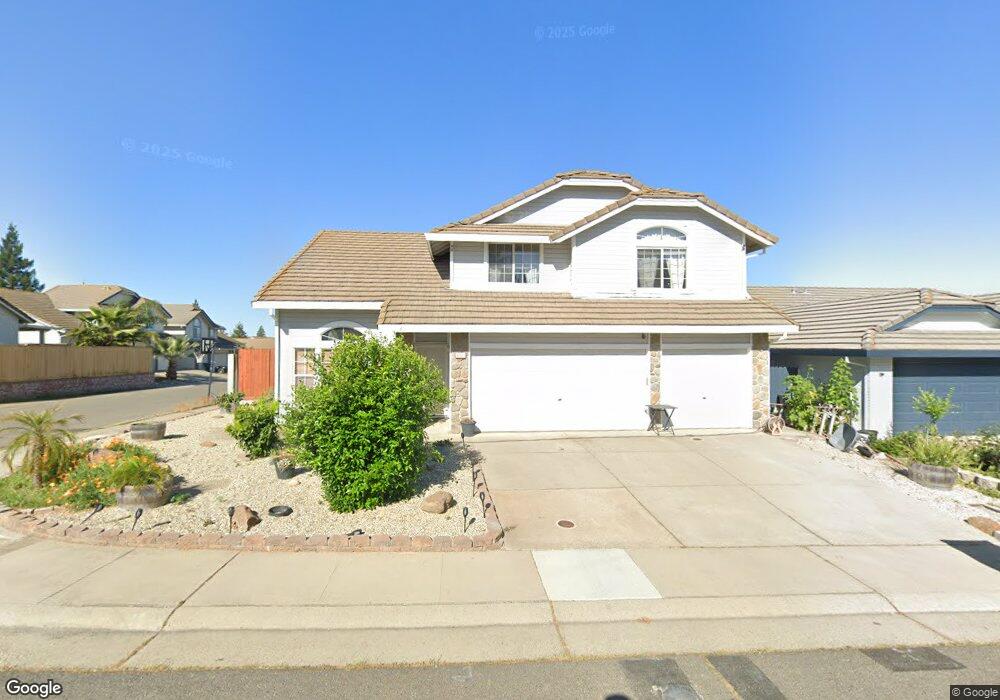
8701 Dishers Way Antelope, CA 95843
Estimated Value: $369,000 - $550,109
4
Beds
3
Baths
1,819
Sq Ft
$275/Sq Ft
Est. Value
About This Home
This home is located at 8701 Dishers Way, Antelope, CA 95843 and is currently estimated at $501,027, approximately $275 per square foot. 8701 Dishers Way is a home located in Sacramento County with nearby schools including Oak Hill Elementary School, Wilson C. Riles Middle School, and Center High School.
Ownership History
Date
Name
Owned For
Owner Type
Purchase Details
Closed on
Mar 2, 2000
Sold by
Hite Philip S and Hite Bonghui
Bought by
Jennings Michael L and Jennings Danielle Y
Current Estimated Value
Home Financials for this Owner
Home Financials are based on the most recent Mortgage that was taken out on this home.
Original Mortgage
$184,900
Outstanding Balance
$62,304
Interest Rate
8.21%
Mortgage Type
VA
Estimated Equity
$438,723
Purchase Details
Closed on
May 15, 1997
Sold by
John Mourier Construction Inc
Bought by
Dato Elmer R and Dato Cheryl D
Home Financials for this Owner
Home Financials are based on the most recent Mortgage that was taken out on this home.
Original Mortgage
$143,374
Interest Rate
8.15%
Mortgage Type
FHA
Purchase Details
Closed on
May 1, 1997
Sold by
John Mourier Construction Inc
Bought by
Hite Philip S and Hite Bonghui
Home Financials for this Owner
Home Financials are based on the most recent Mortgage that was taken out on this home.
Original Mortgage
$143,374
Interest Rate
8.15%
Mortgage Type
FHA
Create a Home Valuation Report for This Property
The Home Valuation Report is an in-depth analysis detailing your home's value as well as a comparison with similar homes in the area
Home Values in the Area
Average Home Value in this Area
Purchase History
| Date | Buyer | Sale Price | Title Company |
|---|---|---|---|
| Jennings Michael L | $185,000 | Chicago Title Co | |
| Dato Elmer R | $146,000 | Stewart Title | |
| Hite Philip S | $154,000 | Stewart Title |
Source: Public Records
Mortgage History
| Date | Status | Borrower | Loan Amount |
|---|---|---|---|
| Open | Jennings Michael L | $184,900 | |
| Previous Owner | Dato Elmer R | $143,374 | |
| Previous Owner | Hite Philip S | $121,550 |
Source: Public Records
Tax History
| Year | Tax Paid | Tax Assessment Tax Assessment Total Assessment is a certain percentage of the fair market value that is determined by local assessors to be the total taxable value of land and additions on the property. | Land | Improvement |
|---|---|---|---|---|
| 2025 | $3,625 | $305,886 | $61,465 | $244,421 |
| 2024 | $3,625 | $299,889 | $60,260 | $239,629 |
| 2023 | $3,547 | $294,010 | $59,079 | $234,931 |
| 2022 | $3,517 | $288,246 | $57,921 | $230,325 |
| 2021 | $3,610 | $282,595 | $56,786 | $225,809 |
| 2020 | $3,891 | $279,698 | $56,204 | $223,494 |
| 2019 | $3,546 | $274,214 | $55,102 | $219,112 |
| 2018 | $3,466 | $268,838 | $54,022 | $214,816 |
| 2017 | $3,363 | $263,567 | $52,963 | $210,604 |
| 2016 | $3,301 | $258,400 | $51,925 | $206,475 |
| 2015 | $4,001 | $254,520 | $51,146 | $203,374 |
| 2014 | $4,347 | $249,536 | $50,145 | $199,391 |
Source: Public Records
Map
Nearby Homes
- 3449 Birchdale Way
- 8432 Giverny Cir
- 3724 Black Eagle Dr
- 5160 Huckleberry Way
- 8148 Orchid Tree Way
- 9129 Redwater Dr
- 8425 Morning Skye Way
- 8111 Aztec Way
- 9620 Mason Trails Rd
- 8040 Aldred Way
- 3941 Grey Livery Way
- 4729 Durum Way
- 4009 Honey Rose Place
- 3457 Misty Lake Dr
- 4115 Copper Hill Ct
- 4133 Singing Tree Way
- 2370 Missouri Way
- 7828 Delaney Dr
- 3537 Misty Lake Dr
- 3541 Misty Lake Dr
- 8705 Dishers Way
- 3213 White Canyon Way
- 8645 Dishers Way
- 8709 Dishers Way
- 3209 White Canyon Way
- 8700 Dishers Way
- 3212 White Canyon Way
- 8704 Dishers Way
- 3214 Alder Hill Ct
- 8648 Dishers Way
- 8641 Dishers Way
- 8713 Dishers Way
- 3208 White Canyon Way
- 8708 Dishers Way
- 3205 White Canyon Way
- 8644 Dishers Way
- 3210 Alder Hill Ct
- 3204 White Canyon Way
- 8712 Dishers Way
- 8640 Dishers Way
Your Personal Tour Guide
Ask me questions while you tour the home.