Estimated Value: $837,000 - $1,145,843
4
Beds
4
Baths
3,215
Sq Ft
$308/Sq Ft
Est. Value
About This Home
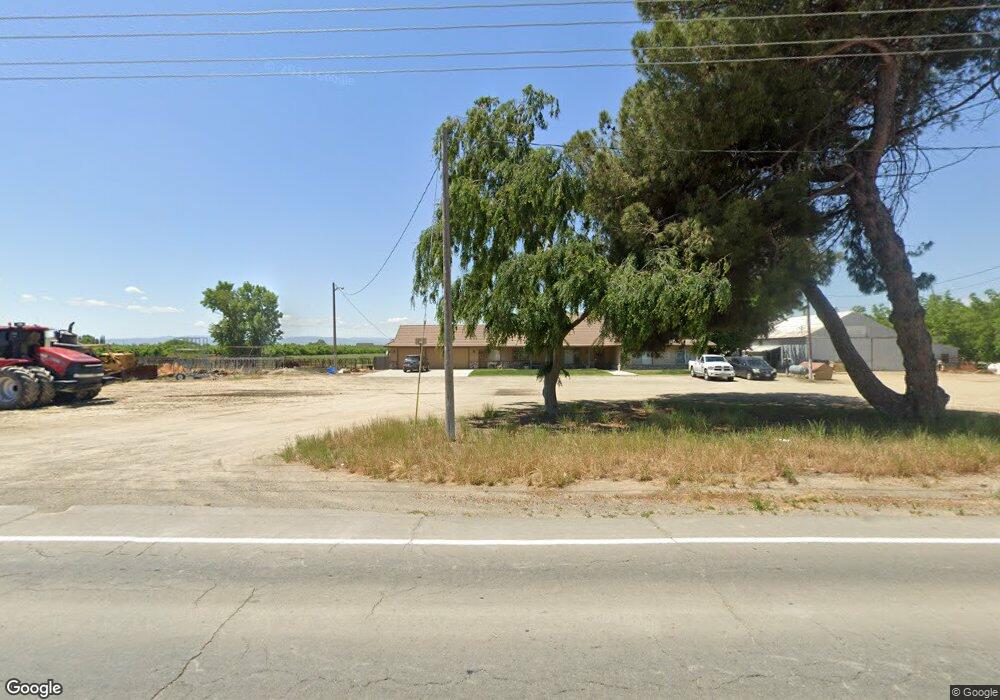
This home is located at 8707 Crows Landing Rd, Ceres, CA 95307 and is currently estimated at $991,422, approximately $308 per square foot. 8707 Crows Landing Rd is a home located in Stanislaus County with nearby schools including Chatom Elementary School, Mountain View Middle School, and Turlock Junior High School.
Ownership History
Date
Name
Owned For
Owner Type
Purchase Details
Closed on
Nov 20, 2023
Sold by
Foiada Charles J and Foiada Karla A
Bought by
Charles And Karla Foiada 2023 Trust and Foiada
Current Estimated Value
Purchase Details
Closed on
Oct 12, 2021
Sold by
Turlock Irrigation District
Bought by
Foiada Charles J and Foiada Karla A
Purchase Details
Closed on
Jul 24, 2003
Sold by
Foiada Mary
Bought by
Foiada Charles J and Foiada Karla A
Home Financials for this Owner
Home Financials are based on the most recent Mortgage that was taken out on this home.
Original Mortgage
$177,000
Interest Rate
5.13%
Mortgage Type
Unknown
Purchase Details
Closed on
Feb 20, 2001
Sold by
Foiada Mary
Bought by
Foiada Charles J and Foiada Karla
Purchase Details
Closed on
Dec 30, 1996
Sold by
Foiada Mary A
Bought by
Foiada Mary and Foiada Charles J
Create a Home Valuation Report for This Property
The Home Valuation Report is an in-depth analysis detailing your home's value as well as a comparison with similar homes in the area
Purchase History
| Date | Buyer | Sale Price | Title Company |
|---|---|---|---|
| Charles And Karla Foiada 2023 Trust | -- | None Listed On Document | |
| Foiada Charles J | -- | -- | |
| Foiada Charles J | -- | Chicago Title | |
| Foiada Charles J | -- | -- | |
| Foiada Mary | -- | -- | |
| Foiada Mary | -- | -- |
Source: Public Records
Mortgage History
| Date | Status | Borrower | Loan Amount |
|---|---|---|---|
| Previous Owner | Foiada Charles J | $177,000 |
Source: Public Records
Tax History
| Year | Tax Paid | Tax Assessment Tax Assessment Total Assessment is a certain percentage of the fair market value that is determined by local assessors to be the total taxable value of land and additions on the property. | Land | Improvement |
|---|---|---|---|---|
| 2025 | $5,188 | $487,245 | $61,465 | $425,780 |
| 2024 | $5,064 | $477,692 | $60,260 | $417,432 |
| 2023 | $5,070 | $468,327 | $59,079 | $409,248 |
| 2022 | $4,998 | $459,145 | $57,921 | $401,224 |
| 2021 | $4,920 | $450,143 | $56,786 | $393,357 |
| 2020 | $4,856 | $445,528 | $56,204 | $389,324 |
| 2019 | $4,780 | $436,793 | $55,102 | $381,691 |
| 2018 | $4,775 | $428,229 | $54,022 | $374,207 |
| 2017 | $4,621 | $419,833 | $52,963 | $366,870 |
| 2016 | $4,459 | $411,602 | $51,925 | $359,677 |
| 2015 | $4,434 | $405,421 | $51,146 | $354,275 |
| 2014 | $4,352 | $397,481 | $50,145 | $347,336 |
Source: Public Records
Map
Nearby Homes
- 1237 W Keyes Rd
- 8631 Mitchell Rd
- 5237 Crows Landing Rd
- 2030 E Grayson Rd Unit 42
- 2030 E Grayson Rd Unit 44
- 2030 E Grayson Rd Unit 41
- 1269 Marchy Ln
- 1299 Marchy Ln
- 4396 Admiral Ct
- 4376 Admiral Ct
- 1279 Montclaire Dr
- 16642 Hickory Ave
- 4449 S Carpenter Rd Unit B12
- 4449 S Carpenter Rd Unit C-1
- 5313 Prairie Flower Rd
- 1440 Don Pedro Rd
- 3816 Teek Ct
- 13807 Carpenter Rd
- 3816 Dano Ct
- 3608 Cassie Ln
- 8639 Crows Landing Rd
- 8807 Crows Landing Rd
- 8637 Crows Landing Rd
- 8554 Crows Landing Rd
- 8524 Crows Landing Rd
- 106 W Tuolumne Rd
- 324 El Katrina Ln
- 324 W Tuolumne Rd
- 431 W Fulkerth Rd
- 406 W Fulkerth Rd
- 8406 Crows Landing Rd
- 9118 Crows Landing Rd
- 412 W Tuolumne Rd
- 413 W Tuolumne Rd
- 601 W Fulkerth Rd
- 547 El Katrina Ln
- 9224 Crows Landing Rd
- 773 W Fulkerth Rd
- 8307 Crows Landing Rd
- 700 W Tuolumne Rd
Your Personal Tour Guide
Ask me questions while you tour the home.