Estimated Value: $263,000 - $297,000
3
Beds
2
Baths
1,137
Sq Ft
$248/Sq Ft
Est. Value
About This Home
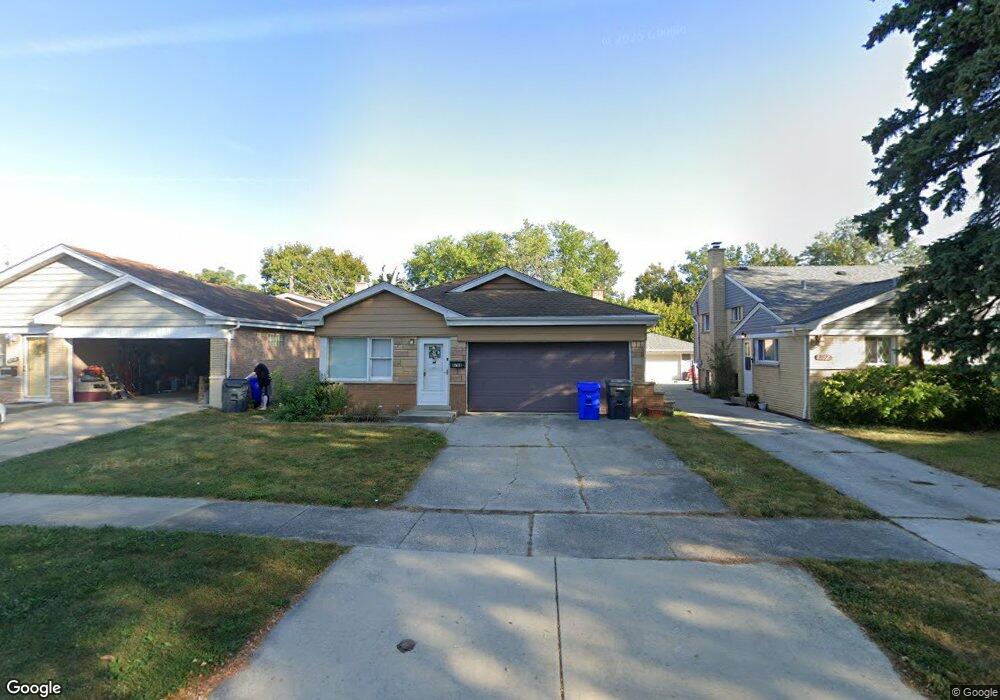
This home is located at 8708 44th St, Lyons, IL 60534 and is currently estimated at $282,505, approximately $248 per square foot. 8708 44th St is a home located in Cook County with nearby schools including Lincoln Elementary School, George Washington Middle School, and J. Sterling Morton High School West.
Ownership History
Date
Name
Owned For
Owner Type
Purchase Details
Closed on
Feb 4, 2004
Sold by
Gonzalez Raul and Labaun Dawn
Bought by
Gonzalez Raul
Current Estimated Value
Purchase Details
Closed on
Jun 26, 1997
Sold by
Bank Of Lyons
Bought by
Gonzalez Raul and Labaun Dawn
Home Financials for this Owner
Home Financials are based on the most recent Mortgage that was taken out on this home.
Original Mortgage
$124,600
Interest Rate
8%
Mortgage Type
FHA
Create a Home Valuation Report for This Property
The Home Valuation Report is an in-depth analysis detailing your home's value as well as a comparison with similar homes in the area
Home Values in the Area
Average Home Value in this Area
Purchase History
| Date | Buyer | Sale Price | Title Company |
|---|---|---|---|
| Gonzalez Raul | -- | Chicago Title Insurance Comp | |
| Gonzalez Raul | $126,000 | -- |
Source: Public Records
Mortgage History
| Date | Status | Borrower | Loan Amount |
|---|---|---|---|
| Previous Owner | Gonzalez Raul | $124,600 |
Source: Public Records
Tax History
| Year | Tax Paid | Tax Assessment Tax Assessment Total Assessment is a certain percentage of the fair market value that is determined by local assessors to be the total taxable value of land and additions on the property. | Land | Improvement |
|---|---|---|---|---|
| 2025 | $5,953 | $23,001 | $3,623 | $19,378 |
| 2024 | $5,953 | $23,001 | $3,623 | $19,378 |
| 2023 | $5,187 | $23,001 | $3,623 | $19,378 |
| 2022 | $5,187 | $17,700 | $3,150 | $14,550 |
| 2021 | $4,948 | $17,699 | $3,150 | $14,549 |
| 2020 | $5,050 | $17,699 | $3,150 | $14,549 |
| 2019 | $4,874 | $16,089 | $2,835 | $13,254 |
| 2018 | $4,764 | $16,089 | $2,835 | $13,254 |
| 2017 | $4,607 | $16,089 | $2,835 | $13,254 |
| 2016 | $5,750 | $17,268 | $2,520 | $14,748 |
| 2015 | $5,576 | $17,268 | $2,520 | $14,748 |
| 2014 | $5,401 | $17,268 | $2,520 | $14,748 |
| 2013 | $5,352 | $18,348 | $2,520 | $15,828 |
Source: Public Records
Map
Nearby Homes
- 8625 43rd St
- 8745 43rd St
- 4247 Anna Ave
- 4228 Konrad Ave
- 8834 Plainfield Rd
- 4218 Konrad Ave
- 4524 1st Ave
- 8667 Plainfield Rd
- 4627 Custer Ave
- 8803 Ogden Ave
- 8332 44th Place
- 4053 Rose Ave
- 4040 Rose Ave
- 8636 40th St
- 4032 Prairie Ave
- 4539 Clyde Ave
- 4239 Park Ave
- 4608 Hawthorne Ave
- 4448 Lawndale Ave
- 4023 Oak Ave
Your Personal Tour Guide
Ask me questions while you tour the home.