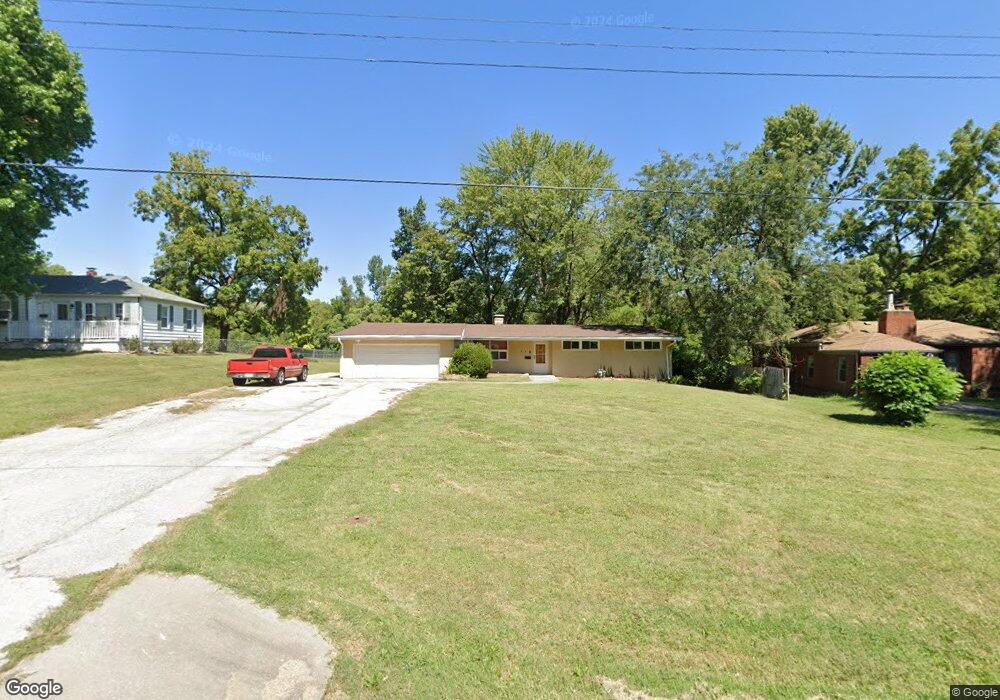
8708 E 81st Terrace Raytown, MO 64138
Estimated Value: $184,000 - $201,121
3
Beds
1
Bath
1,292
Sq Ft
$147/Sq Ft
Est. Value
About This Home
This home is located at 8708 E 81st Terrace, Raytown, MO 64138 and is currently estimated at $190,280, approximately $147 per square foot. 8708 E 81st Terrace is a home located in Jackson County with nearby schools including Spring Valley Elementary, South Middle School, and Carver Christian Academy.
Ownership History
Date
Name
Owned For
Owner Type
Purchase Details
Closed on
Feb 15, 2021
Sold by
Allen Richard A
Bought by
Burnam Brandon
Current Estimated Value
Home Financials for this Owner
Home Financials are based on the most recent Mortgage that was taken out on this home.
Original Mortgage
$56,000
Outstanding Balance
$50,042
Interest Rate
2.65%
Mortgage Type
New Conventional
Estimated Equity
$140,238
Purchase Details
Closed on
Mar 26, 2019
Sold by
Allen John and Allen John M
Bought by
Allen Richard A
Purchase Details
Closed on
Jun 28, 2007
Sold by
Carmack Rodney R and Carmack Shannon D
Bought by
Allen John
Home Financials for this Owner
Home Financials are based on the most recent Mortgage that was taken out on this home.
Original Mortgage
$84,000
Interest Rate
6.37%
Mortgage Type
Purchase Money Mortgage
Purchase Details
Closed on
Oct 5, 2001
Sold by
Hoover Carolyn Sue and Gale Leroy
Bought by
Carmack Rodney R and Carmack Shannon D
Create a Home Valuation Report for This Property
The Home Valuation Report is an in-depth analysis detailing your home's value as well as a comparison with similar homes in the area
Home Values in the Area
Average Home Value in this Area
Purchase History
| Date | Buyer | Sale Price | Title Company |
|---|---|---|---|
| Burnam Brandon | -- | None Available | |
| Allen Richard A | -- | Accommodation | |
| Allen John | -- | Trusted Title | |
| Carmack Rodney R | $45,000 | Security Land Title Co |
Source: Public Records
Mortgage History
| Date | Status | Borrower | Loan Amount |
|---|---|---|---|
| Open | Burnam Brandon | $56,000 | |
| Previous Owner | Allen John | $84,000 |
Source: Public Records
Tax History Compared to Growth
Tax History
| Year | Tax Paid | Tax Assessment Tax Assessment Total Assessment is a certain percentage of the fair market value that is determined by local assessors to be the total taxable value of land and additions on the property. | Land | Improvement |
|---|---|---|---|---|
| 2025 | $1,797 | $21,358 | $5,943 | $15,415 |
| 2024 | $1,785 | $19,918 | $5,265 | $14,653 |
| 2023 | $1,785 | $19,918 | $3,637 | $16,281 |
| 2022 | $1,519 | $16,150 | $3,310 | $12,840 |
| 2021 | $1,524 | $16,150 | $3,310 | $12,840 |
| 2020 | $1,541 | $16,168 | $3,310 | $12,858 |
| 2019 | $1,533 | $16,168 | $3,310 | $12,858 |
| 2018 | $1,288 | $14,071 | $2,881 | $11,190 |
| 2017 | $1,249 | $14,071 | $2,881 | $11,190 |
| 2016 | $1,249 | $13,718 | $4,305 | $9,413 |
| 2014 | $1,225 | $13,319 | $4,180 | $9,139 |
Source: Public Records
Map
Nearby Homes
- 8816 E 81st St
- 8540 E 81st Terrace
- 8818 E 80th Terrace
- 8007 Blue Ridge Blvd
- 8811 E 84th St
- 8808 E 84th Terrace
- 7901 Tennessee Ave
- 8416 E 79th St
- 8512 E 85th St
- 8413 Kentucky Ave
- 8138 Ditzler Ave
- 8819 E 85th St
- 8420 Lane Place
- 8422 Lane Place
- 8500 Everett St
- 8115 E 80th Terrace
- 7867 James A Reed Rd
- 7844 James A Reed Rd
- 8312 Ditzler Ave
- 9012 E 85th Terrace
- 8710 E 81st Terrace
- 8704 E 81st Terrace
- 8716 E 81st Terrace
- 8708 E 81 Terrace
- 8700 E 81st Terrace
- 8709 E 81st Terrace
- 8705 E 81st Terrace
- 8711 E 81st Terrace
- 8711 E 81st Terrace
- 8730 E 81st Terrace
- 8624 E 81st Terrace
- 8114 Spring Valley Rd
- 8112 Spring Valley Rd
- 8701 E 81st Terrace
- 8108 Spring Valley Rd
- 8625 E 81st Terrace
- 8620 E 81st Terrace
- 8106 Spring Valley Rd
- 8616 E 81st Terrace
- 8800 E 81st Terrace