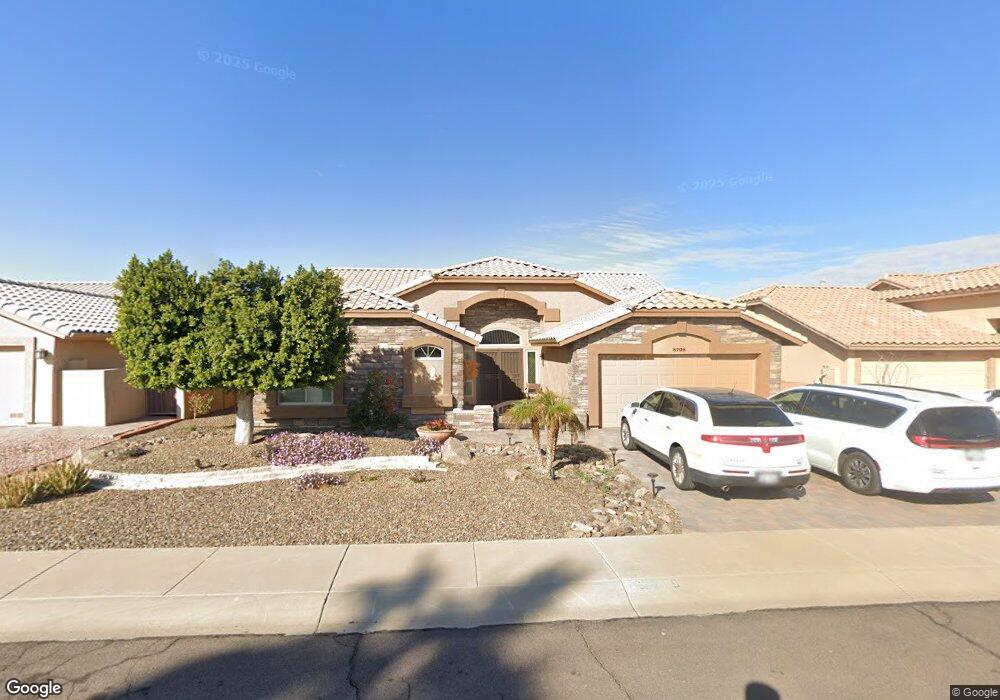
8708 W Mcrae Way Peoria, AZ 85382
Estimated Value: $468,920 - $600,000
3
Beds
2
Baths
2,296
Sq Ft
$244/Sq Ft
Est. Value
About This Home
This home is located at 8708 W Mcrae Way, Peoria, AZ 85382 and is currently estimated at $559,230, approximately $243 per square foot. 8708 W Mcrae Way is a home located in Maricopa County with nearby schools including Apache Elementary School, Sunrise Mountain High School, and Sonoran Science Academy-Peoria.
Ownership History
Date
Name
Owned For
Owner Type
Purchase Details
Closed on
May 24, 2024
Sold by
Lyng Joyce R
Bought by
Joyce R Lyng Trust and Lyng
Current Estimated Value
Purchase Details
Closed on
May 6, 2004
Sold by
Lyng Joseph D
Bought by
Lyng Joyce R
Purchase Details
Closed on
May 21, 2003
Sold by
Lyng Joseph D
Bought by
Lyng Joyce R
Purchase Details
Closed on
Apr 30, 2003
Sold by
Grosse Lucille M
Bought by
Lyng Joyce R
Purchase Details
Closed on
Oct 22, 1996
Sold by
Grosse Paul J and Grosse Lucille
Bought by
Grosse Paul J and Grosse Lucille M
Purchase Details
Closed on
Mar 19, 1994
Sold by
Driskell James H and Driskell Jo C
Bought by
Grosse Paul and Grosse Lucille
Home Financials for this Owner
Home Financials are based on the most recent Mortgage that was taken out on this home.
Original Mortgage
$169,000
Interest Rate
7.25%
Mortgage Type
Purchase Money Mortgage
Create a Home Valuation Report for This Property
The Home Valuation Report is an in-depth analysis detailing your home's value as well as a comparison with similar homes in the area
Home Values in the Area
Average Home Value in this Area
Purchase History
| Date | Buyer | Sale Price | Title Company |
|---|---|---|---|
| Joyce R Lyng Trust | -- | None Listed On Document | |
| Lyng Joyce R | -- | Transnation Title | |
| Lyng Joyce R | -- | First American Title Ins Co | |
| Lyng Joyce R | $220,000 | First American Title Ins Co | |
| Grosse Paul J | -- | -- | |
| Grosse Paul | $169,000 | First Service Title Agency I |
Source: Public Records
Mortgage History
| Date | Status | Borrower | Loan Amount |
|---|---|---|---|
| Previous Owner | Grosse Paul | $169,000 |
Source: Public Records
Tax History Compared to Growth
Tax History
| Year | Tax Paid | Tax Assessment Tax Assessment Total Assessment is a certain percentage of the fair market value that is determined by local assessors to be the total taxable value of land and additions on the property. | Land | Improvement |
|---|---|---|---|---|
| 2025 | $2,941 | $31,470 | -- | -- |
| 2024 | $2,885 | $29,972 | -- | -- |
| 2023 | $2,885 | $36,200 | $7,240 | $28,960 |
| 2022 | $2,828 | $29,960 | $5,990 | $23,970 |
| 2021 | $2,962 | $28,370 | $5,670 | $22,700 |
| 2020 | $2,981 | $27,120 | $5,420 | $21,700 |
| 2019 | $2,891 | $25,210 | $5,040 | $20,170 |
| 2018 | $2,804 | $24,060 | $4,810 | $19,250 |
| 2017 | $2,797 | $22,510 | $4,500 | $18,010 |
| 2016 | $2,764 | $21,300 | $4,260 | $17,040 |
| 2015 | $2,572 | $21,150 | $4,230 | $16,920 |
Source: Public Records
Map
Nearby Homes
- 8720 W Willowbrook Dr
- 8529 W Rockwood Dr
- 8517 W Rockwood Dr
- 8449 W Rockwood Dr
- 8737 W Kimberly Way
- 8420 W Audrey Ln
- 8546 W Wescott Dr
- 18227 N 85th Dr
- 8502 W Kimberly Way
- 18729 N 84th Dr
- 8370 W Audrey Ln
- 18229 N 89th Dr
- 8958 W Rosemonte Dr
- 8402 W Rosemonte Dr
- 8502 W Topeka Dr
- 8332 W Troy St
- 17980 N 88th Ave
- 8962 W Wescott Dr
- 18830 N 83rd Ln
- 8939 W Villa Rita Dr
- 8702 W Mcrae Way
- 8714 W Mcrae Way
- 8701 W Rockwood Dr
- 8713 W Rockwood Dr
- 8646 W Mcrae Way
- 8707 W Mcrae Way
- 8645 W Rockwood Dr
- 8720 W Mcrae Way
- 8701 W Mcrae Way
- 8719 W Rockwood Dr
- 8713 W Mcrae Way
- 8640 W Mcrae Way
- 8645 W Mcrae Way
- 8639 W Rockwood Dr
- 8725 W Rockwood Dr
- 8719 W Mcrae Way
- 8639 W Mcrae Way
- 8634 W Mcrae Way
- 8708 W Rockwood Dr
- 8731 W Rockwood Dr