
Landlord's Agent in 2014
Lawrence Lo
Lawson Tx Realty
(713) 270-1298
6 in this area
43 Total Sales

Estimated Value: $136,627 - $191,000
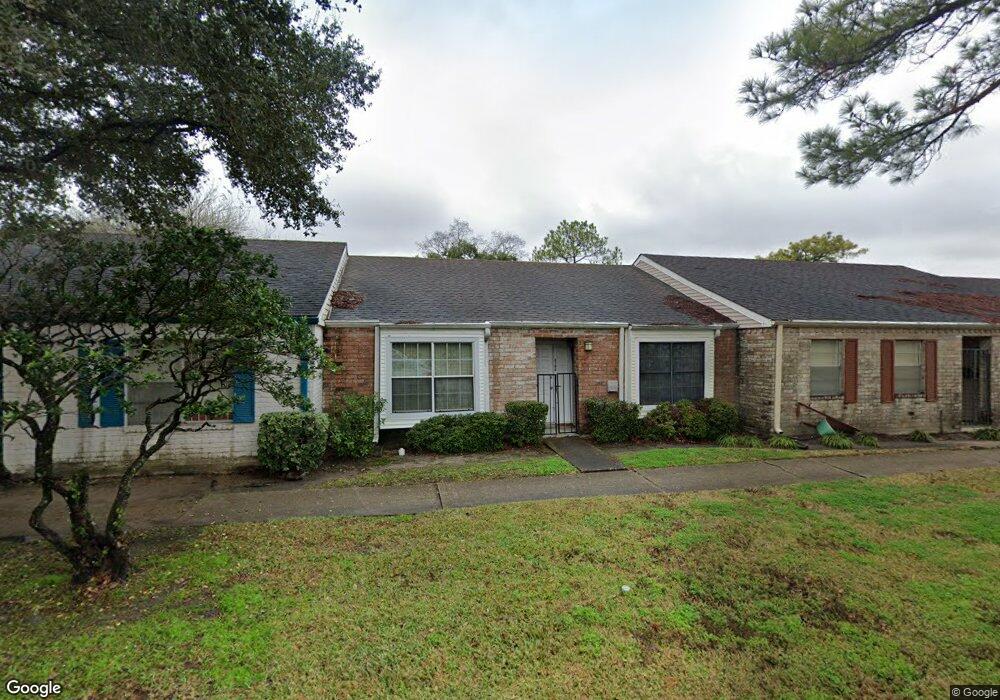
Very nice & clean townhome recently upgraded. Interior fresh paint, new carpet and new appliances. Easy access to Hwy 59 and Beltway 8. Short distance to the Galleria and Downtown. Fridge is included. Swimming pool is in complex. Nice porch and fruit tree in the back.
| Date | Buyer | Sale Price | Title Company |
|---|---|---|---|
| Keerio Mumtaz Ahmed | -- | None Available | |
| Warwas Wendy | -- | None Available | |
| Simons Gregory W | -- | Commonwealth Land Title Co |
| Date | Status | Borrower | Loan Amount |
|---|---|---|---|
| Open | Keerio Mumtaz Ahmed | $61,628 | |
| Previous Owner | Simons Gregory W | $28,500 |
| Date | Event | Price | List to Sale | Price per Sq Ft |
|---|---|---|---|---|
| 12/15/2014 12/15/14 | Rented | $925 | -7.5% | -- |
| 11/15/2014 11/15/14 | Under Contract | -- | -- | -- |
| 10/26/2014 10/26/14 | For Rent | $1,000 | -- | -- |
| Year | Tax Paid | Tax Assessment Tax Assessment Total Assessment is a certain percentage of the fair market value that is determined by local assessors to be the total taxable value of land and additions on the property. | Land | Improvement |
|---|---|---|---|---|
| 2025 | $3,161 | $139,152 | $31,650 | $107,502 |
| 2024 | $3,161 | $139,152 | $31,650 | $107,502 |
| 2023 | $3,161 | $139,152 | $31,650 | $107,502 |
| 2022 | $2,912 | $120,045 | $31,650 | $88,395 |
| 2021 | $2,420 | $99,151 | $16,880 | $82,271 |
| 2020 | $2,257 | $89,260 | $16,880 | $72,380 |
| 2019 | $2,336 | $84,821 | $16,880 | $67,941 |
| 2018 | $1,038 | $78,044 | $16,880 | $61,164 |
| 2017 | $2,128 | $78,044 | $16,880 | $61,164 |
| 2016 | $1,838 | $67,407 | $16,880 | $50,527 |
| 2015 | $1,475 | $63,995 | $16,880 | $47,115 |
| 2014 | $1,475 | $55,563 | $16,880 | $38,683 |
Landlord's Agent in 2014
Lawrence Lo
Lawson Tx Realty
(713) 270-1298
6 in this area
43 Total Sales
Source: Houston Association of REALTORS®
MLS Number: 34905348
APN: 1034280020047
Disclaimer: Certain information contained herein is derived from information provided by parties other than Homes.com. All information provided is deemed reliable, but is not guaranteed to be accurate and should be independently verified.
![]() Copyright 2026, Houston REALTORS® Information Service, Inc.
Copyright 2026, Houston REALTORS® Information Service, Inc.
The information provided is exclusively for consumers’ personal, non-commercial use, and may not be used for any purpose other than to identify prospective properties consumers may be interested in purchasing.
Information is deemed reliable but not guaranteed.
Ask me questions while you tour the home.