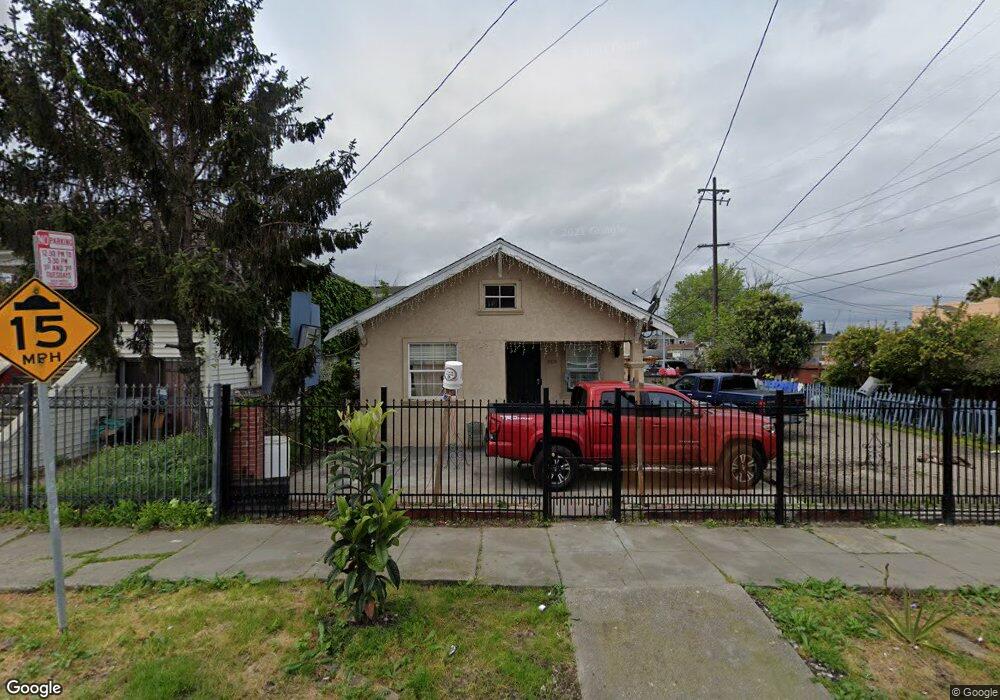
8709 D St Oakland, CA 94621
Highland NeighborhoodEstimated Value: $393,000 - $553,000
3
Beds
1
Bath
902
Sq Ft
$503/Sq Ft
Est. Value
About This Home
This home is located at 8709 D St, Oakland, CA 94621 and is currently estimated at $453,405, approximately $502 per square foot. 8709 D St is a home located in Alameda County with nearby schools including New Highland Academy, Acorn Woodland Elementary School, and Encompass Academy Elementary.
Ownership History
Date
Name
Owned For
Owner Type
Purchase Details
Closed on
Sep 8, 2023
Sold by
Gabino Rodriguez Living Trust
Bought by
Rodriguez Cesario and Gomez Rosa L
Current Estimated Value
Purchase Details
Closed on
Sep 5, 2023
Sold by
Rodriguez Cesario and Gomez Rosa L
Bought by
Fathers House Llc
Purchase Details
Closed on
Feb 23, 2022
Sold by
Rodriguez Gabino V
Bought by
Gabino Rodriguez Living Trust
Purchase Details
Closed on
Sep 23, 2006
Sold by
Rodriguez Gabino V and Rodriguez Maria Luz
Bought by
Rodriguez Gabino V
Create a Home Valuation Report for This Property
The Home Valuation Report is an in-depth analysis detailing your home's value as well as a comparison with similar homes in the area
Home Values in the Area
Average Home Value in this Area
Purchase History
| Date | Buyer | Sale Price | Title Company |
|---|---|---|---|
| Rodriguez Cesario | -- | None Listed On Document | |
| Fathers House Llc | -- | None Listed On Document | |
| Gabino Rodriguez Living Trust | -- | None Listed On Document | |
| Rodriguez Gabino V | -- | None Available |
Source: Public Records
Tax History
| Year | Tax Paid | Tax Assessment Tax Assessment Total Assessment is a certain percentage of the fair market value that is determined by local assessors to be the total taxable value of land and additions on the property. | Land | Improvement |
|---|---|---|---|---|
| 2025 | $7,973 | $488,987 | $146,696 | $342,291 |
| 2024 | $7,973 | $479,400 | $143,820 | $335,580 |
| 2023 | $3,002 | $82,175 | $54,641 | $27,534 |
| 2022 | $2,847 | $80,563 | $53,569 | $26,994 |
| 2021 | $2,569 | $78,983 | $52,519 | $26,464 |
| 2020 | $2,537 | $78,174 | $51,981 | $26,193 |
| 2019 | $2,345 | $76,641 | $50,961 | $25,680 |
| 2018 | $2,297 | $75,138 | $49,962 | $25,176 |
| 2017 | $2,173 | $73,665 | $48,983 | $24,682 |
| 2016 | $2,009 | $72,222 | $48,023 | $24,199 |
| 2015 | $1,992 | $71,136 | $47,301 | $23,835 |
| 2014 | $1,848 | $69,743 | $46,375 | $23,368 |
Source: Public Records
Map
Nearby Homes
Your Personal Tour Guide
Ask me questions while you tour the home.