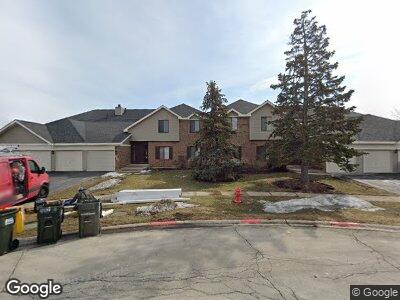
871 Cross Creek Ct Unit 3B Roselle, IL 60172
South Schaumburg NeighborhoodEstimated Value: $256,000 - $285,000
3
Beds
--
Bath
1,100
Sq Ft
$242/Sq Ft
Est. Value
About This Home
This home is located at 871 Cross Creek Ct Unit 3B, Roselle, IL 60172 and is currently estimated at $266,228, approximately $242 per square foot. 871 Cross Creek Ct Unit 3B is a home located in Cook County with nearby schools including Frederick Nerge Elementary School, Margaret Mead Junior High School, and J B Conant High School.
Ownership History
Date
Name
Owned For
Owner Type
Purchase Details
Closed on
Nov 30, 2023
Sold by
Jackie Park Revocable Living Trust
Bought by
Lee Hyun Ho
Current Estimated Value
Home Financials for this Owner
Home Financials are based on the most recent Mortgage that was taken out on this home.
Original Mortgage
$184,000
Outstanding Balance
$182,426
Interest Rate
7.88%
Mortgage Type
New Conventional
Estimated Equity
$66,870
Purchase Details
Closed on
Feb 1, 2021
Sold by
Park Jackie
Bought by
Jackie Park Revocable Living Trust
Purchase Details
Closed on
Oct 29, 2020
Sold by
Dmg Management Llc 871
Bought by
Park Jackie
Purchase Details
Closed on
Aug 17, 2009
Sold by
Schmitt Jerome A and Schmitt Irene M
Bought by
Dmg Management Llc
Create a Home Valuation Report for This Property
The Home Valuation Report is an in-depth analysis detailing your home's value as well as a comparison with similar homes in the area
Home Values in the Area
Average Home Value in this Area
Purchase History
| Date | Buyer | Sale Price | Title Company |
|---|---|---|---|
| Lee Hyun Ho | $230,000 | None Listed On Document | |
| Jackie Park Revocable Living Trust | -- | Alliance Title Corporation | |
| Park Jackie | $194,000 | First American Title | |
| Dmg Management Llc | $158,000 | Attorneys Title Guaranty Fun |
Source: Public Records
Mortgage History
| Date | Status | Borrower | Loan Amount |
|---|---|---|---|
| Open | Lee Hyun Ho | $184,000 | |
| Previous Owner | Dmg Management Llc | $1,000,000 | |
| Previous Owner | Schmitt Irene M | $204,750 |
Source: Public Records
Tax History Compared to Growth
Tax History
| Year | Tax Paid | Tax Assessment Tax Assessment Total Assessment is a certain percentage of the fair market value that is determined by local assessors to be the total taxable value of land and additions on the property. | Land | Improvement |
|---|---|---|---|---|
| 2024 | $5,348 | $19,074 | $1,259 | $17,815 |
| 2023 | $5,348 | $19,074 | $1,259 | $17,815 |
| 2022 | $5,348 | $19,074 | $1,259 | $17,815 |
| 2021 | $4,736 | $15,021 | $1,079 | $13,942 |
| 2020 | $4,663 | $15,021 | $1,079 | $13,942 |
| 2019 | $4,698 | $16,890 | $1,079 | $15,811 |
| 2018 | $3,784 | $12,265 | $899 | $11,366 |
| 2017 | $3,713 | $12,265 | $899 | $11,366 |
| 2016 | $3,478 | $12,265 | $899 | $11,366 |
| 2015 | $3,581 | $11,594 | $791 | $10,803 |
| 2014 | $3,504 | $11,594 | $791 | $10,803 |
| 2013 | $3,398 | $11,594 | $791 | $10,803 |
Source: Public Records
Map
Nearby Homes
- 531 Cumberland Trail Unit A
- 791 Overland Ct Unit 3
- 35 Plum Grove Rd
- 609 Bryce Trail
- 609 White Sands Bay
- 610 E Woodfield Trail
- 675 Circle Dr Unit 2
- 701 Forum Dr Unit 310
- 1813 Longboat Dr
- 513 N Woodfield Trail
- 7N606 Hawthorne Ave
- 554 N Woodfield Trail
- 734 Bluejay Cir
- 1223 Knottingham Ct Unit 2A
- 658 Cutter Ln
- 1474 Haar Ln
- 830 Knottingham Dr Unit 2B
- 640 Cutter Ln
- 1482 Armstrong Ct
- 920 Surrey Dr Unit 1A
- 871 Cross Creek Ct Unit A3
- 871 Cross Creek Ct Unit 3D
- 871 Cross Creek Ct Unit 3B
- 871 Cross Creek Ct Unit 3A
- 871 Cross Creek Ct Unit 3C
- 871 Cross Creek Ct Unit B-1
- 871 Cross Creek Ct Unit D
- 871 Cross Creek Ct Unit B
- 871 Cross Creek Ct Unit C3
- 871 Cross Creek Ct Unit D3
- 887 Cross Creek Ct Unit 3CC
- 887 Cross Creek Ct Unit 3AA
- 887 Cross Creek Ct Unit 3DD
- 887 Cross Creek Ct Unit 3BB
- 887 Cross Creek Ct Unit 1A
- 857 Cross Creek Ct Unit 2DD
- 857 Cross Creek Ct Unit 2AA
- 857 Cross Creek Ct Unit 2CC
- 857 Cross Creek Ct Unit 2BB
- 841 Cross Creek Ct Unit 2C