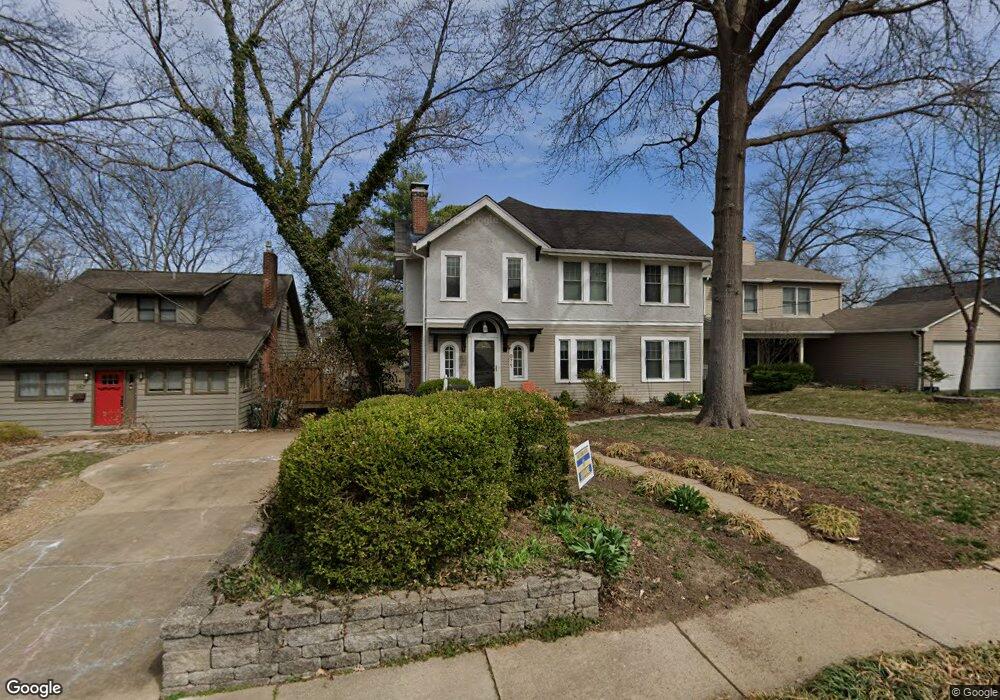
871 Tuxedo Blvd Saint Louis, MO 63119
Estimated Value: $475,000 - $557,000
3
Beds
2
Baths
2,154
Sq Ft
$248/Sq Ft
Est. Value
About This Home
This home is located at 871 Tuxedo Blvd, Saint Louis, MO 63119 and is currently estimated at $534,934, approximately $248 per square foot. 871 Tuxedo Blvd is a home located in St. Louis County with nearby schools including Avery Elementary School, Hixson Middle School, and Webster Groves High School.
Ownership History
Date
Name
Owned For
Owner Type
Purchase Details
Closed on
Dec 29, 2005
Sold by
Hauser Eric J and Hauser Rebecca A
Bought by
Coffman John B and Nelson Kathryn J
Current Estimated Value
Home Financials for this Owner
Home Financials are based on the most recent Mortgage that was taken out on this home.
Original Mortgage
$290,320
Outstanding Balance
$161,566
Interest Rate
6.2%
Mortgage Type
Fannie Mae Freddie Mac
Estimated Equity
$373,368
Purchase Details
Closed on
Dec 14, 2001
Sold by
Martin Ivan Leroy
Bought by
Hauser Eric J and Hauser Rebecca A
Home Financials for this Owner
Home Financials are based on the most recent Mortgage that was taken out on this home.
Original Mortgage
$204,250
Interest Rate
4.4%
Purchase Details
Closed on
Nov 7, 2000
Sold by
Martin Karen Ann
Bought by
Martin Ivan Leroy
Create a Home Valuation Report for This Property
The Home Valuation Report is an in-depth analysis detailing your home's value as well as a comparison with similar homes in the area
Home Values in the Area
Average Home Value in this Area
Purchase History
| Date | Buyer | Sale Price | Title Company |
|---|---|---|---|
| Coffman John B | $362,900 | None Available | |
| Hauser Eric J | $215,000 | -- | |
| Martin Ivan Leroy | -- | -- |
Source: Public Records
Mortgage History
| Date | Status | Borrower | Loan Amount |
|---|---|---|---|
| Open | Coffman John B | $290,320 | |
| Previous Owner | Hauser Eric J | $204,250 |
Source: Public Records
Tax History Compared to Growth
Tax History
| Year | Tax Paid | Tax Assessment Tax Assessment Total Assessment is a certain percentage of the fair market value that is determined by local assessors to be the total taxable value of land and additions on the property. | Land | Improvement |
|---|---|---|---|---|
| 2025 | $5,531 | $88,920 | $41,910 | $47,010 |
| 2024 | $5,531 | $79,520 | $30,500 | $49,020 |
| 2023 | $5,505 | $79,520 | $30,500 | $49,020 |
| 2022 | $5,186 | $69,550 | $30,500 | $39,050 |
| 2021 | $5,168 | $69,550 | $30,500 | $39,050 |
| 2020 | $5,349 | $67,080 | $30,500 | $36,580 |
| 2019 | $5,311 | $67,080 | $30,500 | $36,580 |
| 2018 | $4,511 | $50,520 | $21,340 | $29,180 |
| 2017 | $4,481 | $50,520 | $21,340 | $29,180 |
| 2016 | $4,493 | $48,510 | $18,300 | $30,210 |
| 2015 | $4,513 | $48,510 | $18,300 | $30,210 |
| 2014 | $4,971 | $52,030 | $13,210 | $38,820 |
Source: Public Records
Map
Nearby Homes
- 874 Tuxedo Blvd
- 808 Greeley Ave
- 544 Summit Ave
- 946 Newport Ave
- 570 N Laclede Station Rd
- 554 N Laclede Station Rd
- 1016 Marshall Ave
- 1048 Kuhlman Ln
- 1045 Tuxedo Blvd
- 1052 Kuhlman Ln
- 706 Atalanta Ave
- 7723 Suffolk Ave
- 685 Clark Ave
- 1051 Kuhlman Ln
- 1046 Marshall Ave
- 835 N Forest Ave
- 817 N Forest Ave
- 619 N Bompart Ave
- 1088 Key Ave W
- 804 E Pacific Ave
- 875 Tuxedo Blvd
- 867 Tuxedo Blvd
- 877 Tuxedo Blvd
- 861 Tuxedo Blvd
- 713 Yeatman Ave
- 868 Clark Ave
- 857 Tuxedo Blvd
- 719 Yeatman Ave
- 851 Tuxedo Blvd
- 860 Clark Ave
- 876 Tuxedo Blvd
- 880 Tuxedo Blvd
- 706 Yeatman Ave
- 866 Tuxedo Blvd
- 704 Yeatman Ave
- 849 Tuxedo Blvd
- 712 Yeatman Ave
- 848 Clark Ave
- 856 Tuxedo Blvd
- 714 Yeatman Ave