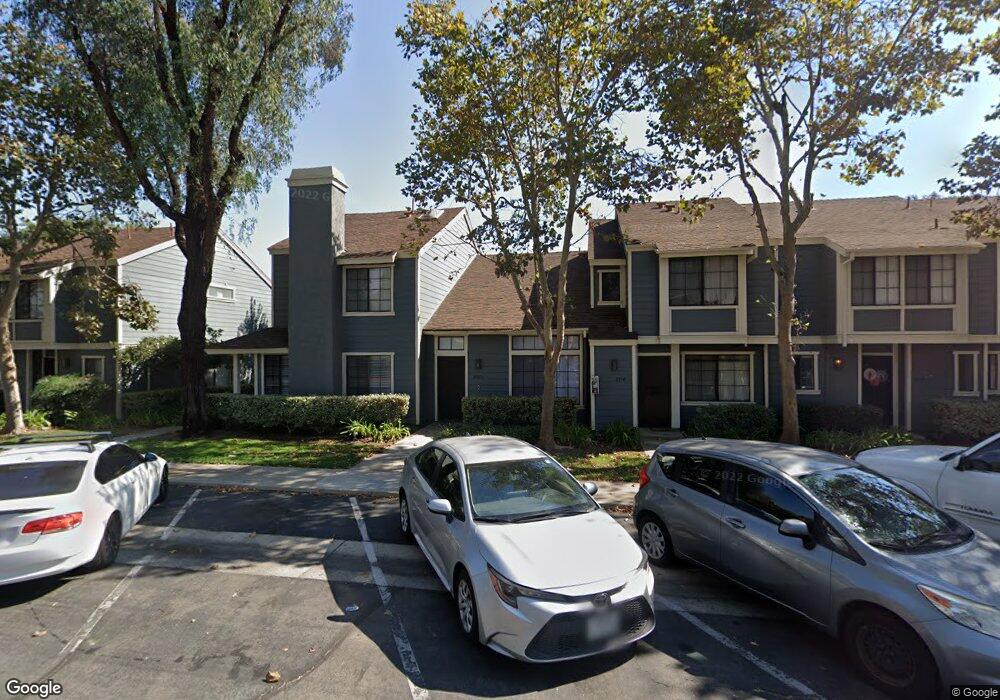
8710 1/2 Pine Crest Place Rancho Cucamonga, CA 91730
Estimated Value: $360,000 - $364,000
1
Bed
2
Baths
799
Sq Ft
$453/Sq Ft
Est. Value
About This Home
This home is located at 8710 1/2 Pine Crest Place, Rancho Cucamonga, CA 91730 and is currently estimated at $362,095, approximately $453 per square foot. 8710 1/2 Pine Crest Place is a home located in San Bernardino County with nearby schools including Cucamonga Elementary, Rancho Cucamonga Middle, and Chaffey High School.
Ownership History
Date
Name
Owned For
Owner Type
Purchase Details
Closed on
Mar 4, 2023
Sold by
Gomez Lorena M
Bought by
Lorena M Gomez Revocable Living Trust
Current Estimated Value
Purchase Details
Closed on
Aug 4, 2021
Sold by
Swonke Christopher John and Costa Lugo Karla
Bought by
Gomez Lorena M
Home Financials for this Owner
Home Financials are based on the most recent Mortgage that was taken out on this home.
Original Mortgage
$111,500
Interest Rate
2.8%
Mortgage Type
New Conventional
Purchase Details
Closed on
Mar 13, 2015
Sold by
Swonke Christopher John
Bought by
Swonke Christopher John and The Christopher Swonke & Karla
Purchase Details
Closed on
May 16, 2005
Sold by
Larue Gary F
Bought by
Swonke Christopher John
Home Financials for this Owner
Home Financials are based on the most recent Mortgage that was taken out on this home.
Original Mortgage
$199,900
Interest Rate
5.75%
Mortgage Type
New Conventional
Create a Home Valuation Report for This Property
The Home Valuation Report is an in-depth analysis detailing your home's value as well as a comparison with similar homes in the area
Purchase History
| Date | Buyer | Sale Price | Title Company |
|---|---|---|---|
| Lorena M Gomez Revocable Living Trust | -- | -- | |
| Gomez Lorena M | $301,500 | Orange Coast Title Company | |
| Swonke Christopher John | -- | None Available | |
| Swonke Christopher John | $249,500 | North American Title Co |
Source: Public Records
Mortgage History
| Date | Status | Borrower | Loan Amount |
|---|---|---|---|
| Previous Owner | Gomez Lorena M | $111,500 | |
| Previous Owner | Swonke Christopher John | $199,900 |
Source: Public Records
Tax History
| Year | Tax Paid | Tax Assessment Tax Assessment Total Assessment is a certain percentage of the fair market value that is determined by local assessors to be the total taxable value of land and additions on the property. | Land | Improvement |
|---|---|---|---|---|
| 2025 | $3,494 | $319,956 | $111,985 | $207,971 |
| 2024 | $3,403 | $313,682 | $109,789 | $203,893 |
| 2023 | $3,327 | $307,531 | $107,636 | $199,895 |
| 2022 | $3,268 | $301,500 | $105,525 | $195,975 |
| 2021 | $3,287 | $300,000 | $105,000 | $195,000 |
| 2020 | $2,887 | $264,300 | $92,000 | $172,300 |
| 2019 | $2,743 | $247,000 | $86,000 | $161,000 |
| 2018 | $2,284 | $205,100 | $72,300 | $132,800 |
| 2017 | $2,096 | $190,800 | $67,300 | $123,500 |
| 2016 | $2,014 | $181,700 | $64,100 | $117,600 |
| 2015 | $1,938 | $173,000 | $61,000 | $112,000 |
| 2014 | $1,917 | $173,000 | $61,000 | $112,000 |
Source: Public Records
Map
Nearby Homes
- 8703 Pine Crest Place
- 10108 24th St
- 10116 Bedford Dr
- 9805 Devon St
- 10215 25th St
- 10151 Arrow Route Unit 59
- 10151 Arrow Route Unit 6
- 8232 Malven Ave
- 10235 Anacapa Ct
- 10239 24th St
- 8214 Klusman Ave
- 8423 Western Trail Place Unit H
- 8425 Sunset Trail Place Unit F
- 9999 Foothill Blvd Unit 48
- 9999 Foothill Blvd Unit 111
- 9999 Foothill Blvd Unit 132
- 10209 26th St
- 9522 Harvest Vista Dr
- 10330 Jaybird Rd
- 10326 Sparkling Dr Unit 1
- 8710 Pine Crest Place
- 8712 Pine Crest Place
- 8708 Pine Crest Place Unit 1/2
- 8708 Pine Crest Place
- 8708 Pine Crest Place
- 8700 Pine Crest Place
- 8714 Pine Crest Place Unit 1/2
- 8714 1/2 Pine Crest Place
- 8714 Pine Crest Place
- 8702 Pine Crest Place
- 8704 Pine Crest Place
- 8716 Pine Crest Place
- 8706 Pine Crest Place
- 8716 1/2 Pine Crest Place
- 8738 Pine Crest Place
- 8740 Pine Crest Place
- 8742 Pine Crest Place
- 8718 Pine Crest Place
- 8718 Pine Crest Place
- 8744 Pine Crest Place
Your Personal Tour Guide
Ask me questions while you tour the home.