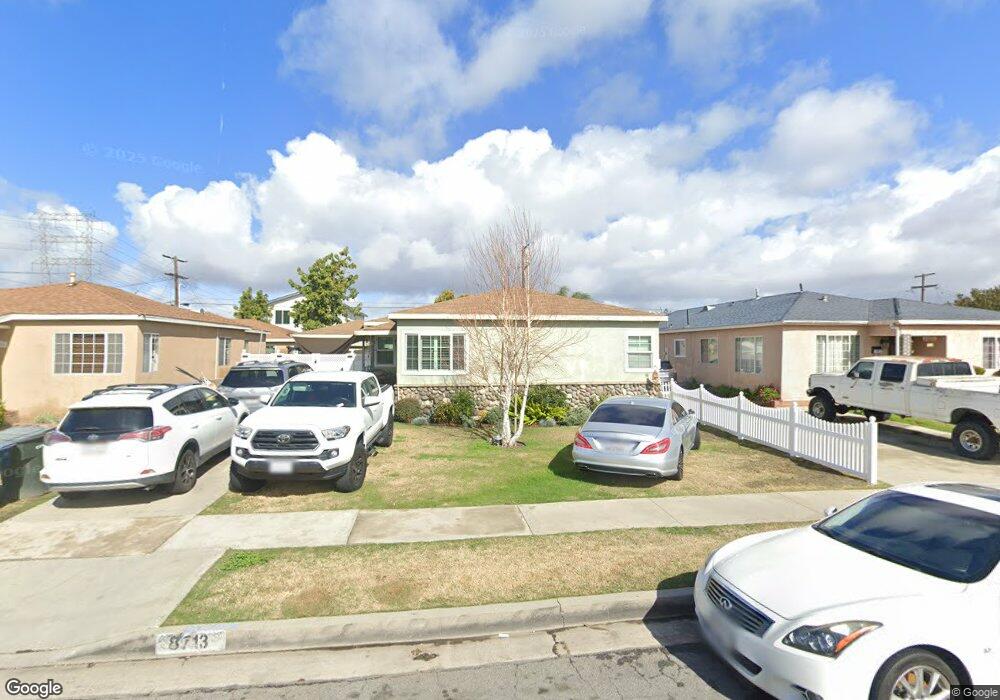
8713 Maple St Bellflower, CA 90706
Estimated Value: $699,000 - $813,000
3
Beds
2
Baths
1,066
Sq Ft
$703/Sq Ft
Est. Value
About This Home
This home is located at 8713 Maple St, Bellflower, CA 90706 and is currently estimated at $749,778, approximately $703 per square foot. 8713 Maple St is a home located in Los Angeles County with nearby schools including Major Lynn Mokler School, Alondra Middle School, and Buena Vista High School.
Ownership History
Date
Name
Owned For
Owner Type
Purchase Details
Closed on
Apr 23, 2025
Sold by
Johnson Nancy Kay
Bought by
Nancy Kay Johnson Revocable Living Trust and Johnson
Current Estimated Value
Purchase Details
Closed on
Feb 4, 2010
Sold by
Johnson Nancy K and Johnson Nancy Kay
Bought by
Johnson Nancy K
Home Financials for this Owner
Home Financials are based on the most recent Mortgage that was taken out on this home.
Original Mortgage
$111,925
Interest Rate
5.12%
Mortgage Type
FHA
Purchase Details
Closed on
Jul 17, 2001
Sold by
Johnson Jerry Lee
Bought by
Johnson Nancy Kay
Create a Home Valuation Report for This Property
The Home Valuation Report is an in-depth analysis detailing your home's value as well as a comparison with similar homes in the area
Home Values in the Area
Average Home Value in this Area
Purchase History
| Date | Buyer | Sale Price | Title Company |
|---|---|---|---|
| Nancy Kay Johnson Revocable Living Trust | -- | None Listed On Document | |
| Johnson Nancy K | -- | Fidelity National Title | |
| Johnson Nancy Kay | -- | -- |
Source: Public Records
Mortgage History
| Date | Status | Borrower | Loan Amount |
|---|---|---|---|
| Previous Owner | Johnson Nancy K | $111,925 |
Source: Public Records
Tax History
| Year | Tax Paid | Tax Assessment Tax Assessment Total Assessment is a certain percentage of the fair market value that is determined by local assessors to be the total taxable value of land and additions on the property. | Land | Improvement |
|---|---|---|---|---|
| 2025 | $2,268 | $151,648 | $59,542 | $92,106 |
| 2024 | $2,268 | $148,675 | $58,375 | $90,300 |
| 2023 | $2,228 | $145,761 | $57,231 | $88,530 |
| 2022 | $2,169 | $142,904 | $56,109 | $86,795 |
| 2021 | $2,118 | $140,103 | $55,009 | $85,094 |
| 2019 | $2,154 | $135,949 | $53,378 | $82,571 |
| 2018 | $1,958 | $133,284 | $52,332 | $80,952 |
| 2016 | $1,762 | $128,109 | $50,300 | $77,809 |
| 2015 | $1,938 | $126,186 | $49,545 | $76,641 |
| 2014 | $1,987 | $123,715 | $48,575 | $75,140 |
Source: Public Records
Map
Nearby Homes
- 8728 Flower St
- 16840 Passage Ave
- 8811 Park St Unit 54
- 8858 Flower St
- 16600 Downey Ave Unit 145
- 16600 Downey Ave Unit 27
- 16600 Downey Ave Unit 60
- 16600 Downey Ave Unit 31
- 16600 Downey Ave Unit 115
- 8808 Olive St
- 17100 Downey Ave
- 16713 Virginia Ave
- 9211 Walnut St
- 3420 E 67th St
- 8826 Artesia Blvd
- 8564 Artesia Blvd
- 9116 Palm St
- 3340 E 67th St
- 9200 Palm St Unit 6
- 8713 Alondra Blvd
Your Personal Tour Guide
Ask me questions while you tour the home.