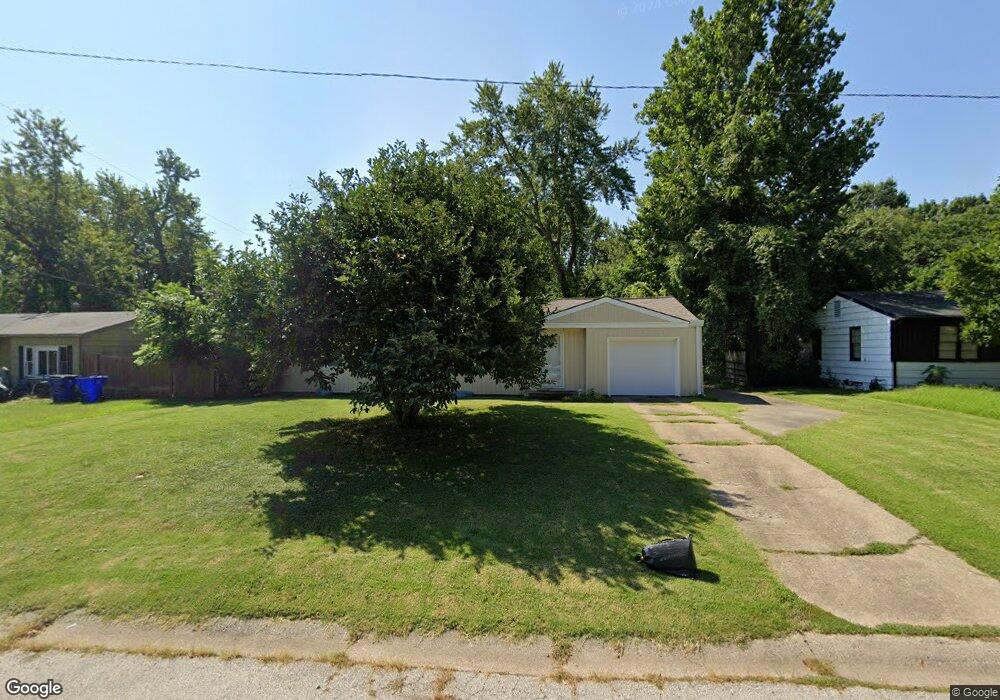
8715 E 79th Terrace Raytown, MO 64138
Estimated Value: $176,000 - $199,000
3
Beds
1
Bath
984
Sq Ft
$189/Sq Ft
Est. Value
About This Home
This home is located at 8715 E 79th Terrace, Raytown, MO 64138 and is currently estimated at $185,985, approximately $189 per square foot. 8715 E 79th Terrace is a home located in Jackson County with nearby schools including Spring Valley Elementary, South Middle School, and Carver Christian Academy.
Ownership History
Date
Name
Owned For
Owner Type
Purchase Details
Closed on
Aug 11, 2006
Sold by
Neece Travis C and Neece Jennifer R
Bought by
Phillips Keith
Current Estimated Value
Purchase Details
Closed on
Oct 16, 2004
Sold by
Neece Travis C and Neece Jennifer
Bought by
Neece Travis C and Neece Jennifer
Home Financials for this Owner
Home Financials are based on the most recent Mortgage that was taken out on this home.
Original Mortgage
$67,939
Interest Rate
5.73%
Mortgage Type
FHA
Purchase Details
Closed on
Jul 5, 2001
Sold by
Vernon Brian W and Vernon Jacqueline A
Bought by
Neece Travis C
Home Financials for this Owner
Home Financials are based on the most recent Mortgage that was taken out on this home.
Original Mortgage
$69,351
Interest Rate
7.2%
Mortgage Type
FHA
Purchase Details
Closed on
Aug 10, 1998
Sold by
Ingold Earl H and Ingold Lola M
Bought by
Vernon Brian W and Vernon Jacqueline A
Home Financials for this Owner
Home Financials are based on the most recent Mortgage that was taken out on this home.
Original Mortgage
$55,600
Interest Rate
6.37%
Mortgage Type
Purchase Money Mortgage
Purchase Details
Closed on
Nov 5, 1997
Sold by
Ingold Lola M
Bought by
Ingold Lola M and Ingold Earl H
Create a Home Valuation Report for This Property
The Home Valuation Report is an in-depth analysis detailing your home's value as well as a comparison with similar homes in the area
Home Values in the Area
Average Home Value in this Area
Purchase History
| Date | Buyer | Sale Price | Title Company |
|---|---|---|---|
| Phillips Keith | -- | Metro One Title | |
| Neece Travis C | -- | Old Republic Title Company O | |
| Neece Travis C | -- | Coffelt Land Title | |
| Vernon Brian W | -- | -- | |
| Ingold Lola M | -- | -- |
Source: Public Records
Mortgage History
| Date | Status | Borrower | Loan Amount |
|---|---|---|---|
| Previous Owner | Neece Travis C | $67,939 | |
| Previous Owner | Neece Travis C | $69,351 | |
| Previous Owner | Vernon Brian W | $55,600 |
Source: Public Records
Tax History
| Year | Tax Paid | Tax Assessment Tax Assessment Total Assessment is a certain percentage of the fair market value that is determined by local assessors to be the total taxable value of land and additions on the property. | Land | Improvement |
|---|---|---|---|---|
| 2025 | $2,449 | $25,128 | $5,364 | $19,764 |
| 2024 | $2,433 | $27,153 | $2,350 | $24,803 |
| 2023 | $2,433 | $27,153 | $2,326 | $24,827 |
| 2022 | $1,787 | $19,000 | $3,886 | $15,114 |
| 2021 | $1,793 | $19,000 | $3,886 | $15,114 |
| 2020 | $1,809 | $18,982 | $3,886 | $15,096 |
| 2019 | $1,799 | $18,982 | $3,886 | $15,096 |
| 2018 | $1,512 | $16,520 | $3,382 | $13,138 |
| 2017 | $1,512 | $16,520 | $3,382 | $13,138 |
| 2016 | $1,466 | $16,106 | $1,957 | $14,149 |
Source: Public Records
Map
Nearby Homes
- 8816 E 81st St
- 8819 E 80th Terrace
- 7867 James A Reed Rd
- 8105 Manning Ave
- 8705 E 83rd Terrace
- 7844 James A Reed Rd
- 7632 Booth Ave
- 8117 Manning Ave
- 8115 E 80th Terrace
- 8604 Countryshire Ln
- 9203 E 79th St
- 8816 E 84th St
- 8811 E 84th St
- 8012 Elm Ave
- 8608 E 84th Terrace
- 7916 Maple Ave
- 7800 Elm Ave
- 8421 Spring Valley Rd
- 7900 Maple Ave
- 9001 E 75th St
- 8719 E 79th Terrace
- 8711 E 79th Terrace
- 8709 E 79th Terrace
- 8712 E 80th Terrace
- 7944 Spring Valley Rd
- 8708 E 80th Terrace
- 8714 E 80th Terrace
- 8705 E 79th Terrace
- 8720 E 79th Terrace
- 8716 E 79th Terrace
- 8712 E 79th Terrace
- 7910 Spring Valley Rd
- 8706 E 80th Terrace
- 8708 E 79th Terrace
- 7950 Spring Valley Rd
- 8701 E 79th Terrace
- 8704 E 80th Terrace
- 7904 Spring Valley Rd
- 8704 E 79th Terrace
- 8700 E 80th Terrace
Your Personal Tour Guide
Ask me questions while you tour the home.