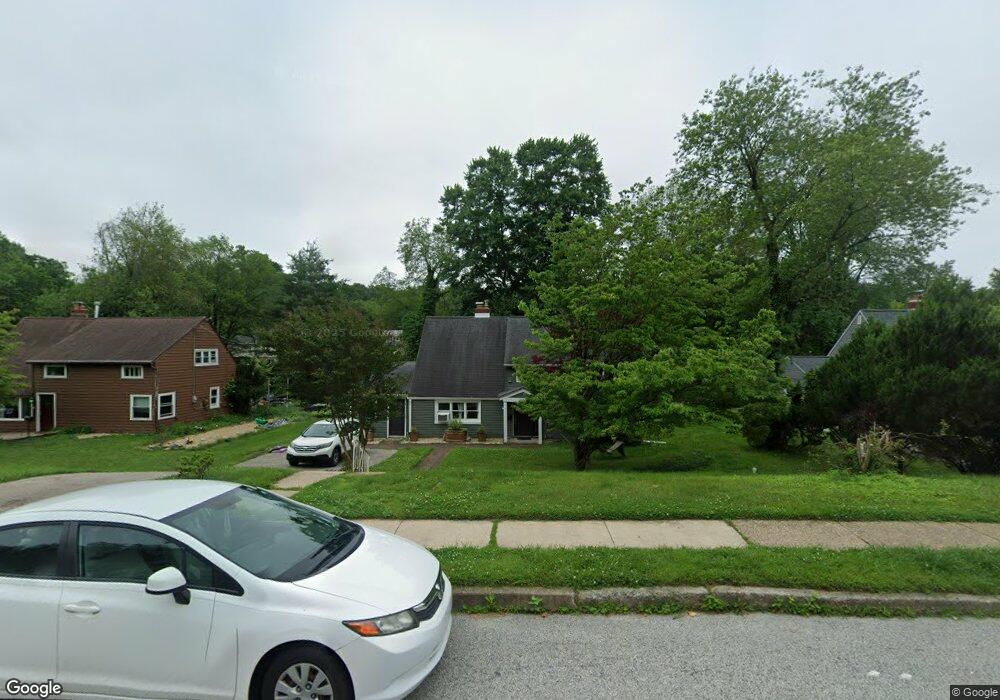
8716 Patton Rd Glenside, PA 19038
Estimated Value: $507,000 - $567,091
4
Beds
2
Baths
2,798
Sq Ft
$190/Sq Ft
Est. Value
About This Home
This home is located at 8716 Patton Rd, Glenside, PA 19038 and is currently estimated at $531,773, approximately $190 per square foot. 8716 Patton Rd is a home located in Montgomery County with nearby schools including Erdenheim Elementary School, Enfield Elementary School, and Springfield Township Middle School.
Ownership History
Date
Name
Owned For
Owner Type
Purchase Details
Closed on
Dec 21, 2009
Sold by
Lynn Michael and Lynn Margaret
Bought by
Lynn Michael and Lynn Margaret
Current Estimated Value
Home Financials for this Owner
Home Financials are based on the most recent Mortgage that was taken out on this home.
Original Mortgage
$206,000
Outstanding Balance
$134,020
Interest Rate
4.85%
Estimated Equity
$397,753
Purchase Details
Closed on
Aug 29, 2003
Sold by
Calamia Libby A and Reilly Mary A
Bought by
Irwin Margaret and Lynn Michael
Home Financials for this Owner
Home Financials are based on the most recent Mortgage that was taken out on this home.
Original Mortgage
$202,400
Interest Rate
6.22%
Purchase Details
Closed on
Jun 30, 1995
Sold by
Roye Alfreda E and Mundy Janet
Bought by
Calamia Libby A and Reilly Mary Alexine
Create a Home Valuation Report for This Property
The Home Valuation Report is an in-depth analysis detailing your home's value as well as a comparison with similar homes in the area
Home Values in the Area
Average Home Value in this Area
Purchase History
| Date | Buyer | Sale Price | Title Company |
|---|---|---|---|
| Lynn Michael | -- | None Available | |
| Irwin Margaret | $253,000 | -- | |
| Calamia Libby A | $134,000 | -- |
Source: Public Records
Mortgage History
| Date | Status | Borrower | Loan Amount |
|---|---|---|---|
| Open | Lynn Michael | $206,000 | |
| Previous Owner | Irwin Margaret | $202,400 |
Source: Public Records
Tax History Compared to Growth
Tax History
| Year | Tax Paid | Tax Assessment Tax Assessment Total Assessment is a certain percentage of the fair market value that is determined by local assessors to be the total taxable value of land and additions on the property. | Land | Improvement |
|---|---|---|---|---|
| 2025 | $6,224 | $132,110 | $51,090 | $81,020 |
| 2024 | $6,224 | $132,110 | $51,090 | $81,020 |
| 2023 | $6,007 | $132,110 | $51,090 | $81,020 |
| 2022 | $5,834 | $132,110 | $51,090 | $81,020 |
| 2021 | $5,682 | $132,110 | $51,090 | $81,020 |
| 2020 | $5,549 | $132,110 | $51,090 | $81,020 |
| 2019 | $5,463 | $132,110 | $51,090 | $81,020 |
| 2018 | $5,464 | $132,110 | $51,090 | $81,020 |
| 2017 | $5,215 | $132,110 | $51,090 | $81,020 |
| 2016 | $5,164 | $132,110 | $51,090 | $81,020 |
| 2015 | $4,908 | $132,110 | $51,090 | $81,020 |
| 2014 | $4,908 | $132,110 | $51,090 | $81,020 |
Source: Public Records
Map
Nearby Homes
- 8612 Trumbauer Dr
- 8705 Patton Rd
- 1104 Cromwell Rd
- 8550 Trumbauer Dr Unit L35
- 8407 Hull Dr
- 402 Longfield Rd
- 303 Glenway Rd
- 223 Larrimore Ln
- 418 Glenway Rd
- 8304 Cheltenham Ave
- 1641 Chattin Rd
- 1001 E Willow Grove Ave
- 106 Montgomery Ave
- 503 E Gravers Ln
- 1005 Harston Ln
- 8408 Prospect Ave
- 1118 E Willow Grove Ave
- 8720 Prospect Ave
- 8708 Prospect Ave Unit B4
- 5 Erdenheim Rd
- 8718 Patton Rd
- 8714 Patton Rd
- 8712 Patton Rd
- 8720 Patton Rd
- 8717 Patton Rd
- 8715 Marshall Rd
- 8715 Patton Rd
- 8713 Marshall Rd
- 8719 Patton Rd
- 8800 Patton Rd
- 8710 Patton Rd
- 8713 Patton Rd
- 8711 Marshall Rd
- 8717 Marshall Rd
- 8721 Patton Rd
- 8711 Patton Rd
- 8708 Patton Rd
- 8802 Patton Rd
- 8709 Marshall Rd
- 8719 Marshall Rd