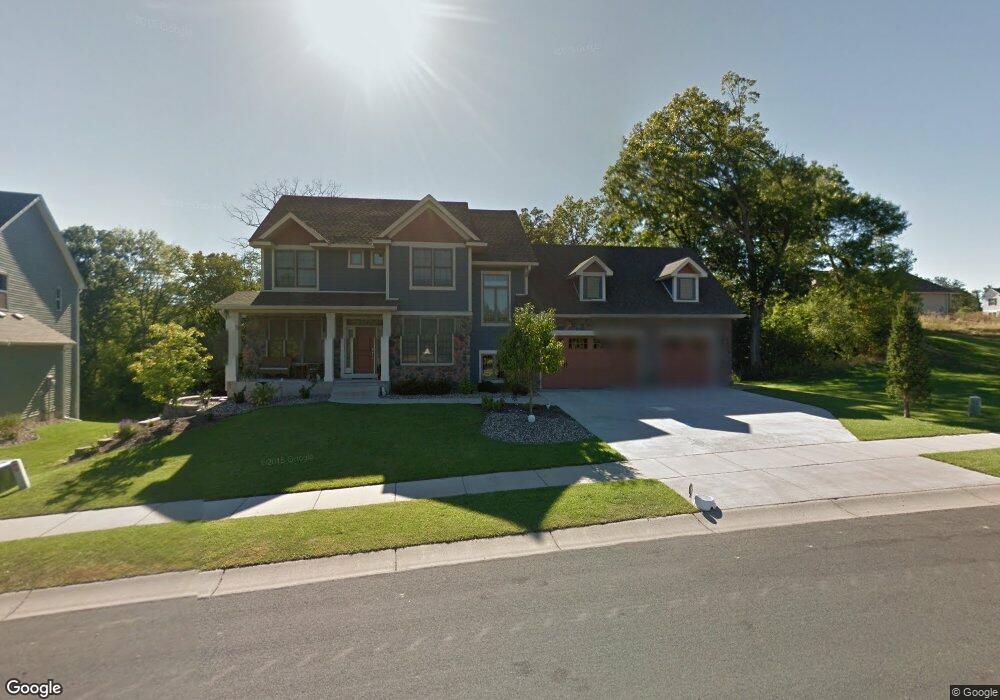
8717 Crismon Way Inver Grove Heights, MN 55076
Estimated Value: $761,000 - $815,000
5
Beds
4
Baths
3,028
Sq Ft
$260/Sq Ft
Est. Value
About This Home
This home is located at 8717 Crismon Way, Inver Grove Heights, MN 55076 and is currently estimated at $786,210, approximately $259 per square foot. 8717 Crismon Way is a home located in Dakota County with nearby schools including Pine Bend Elementary School, Inver Grove Heights Middle School, and Simley Senior High School.
Ownership History
Date
Name
Owned For
Owner Type
Purchase Details
Closed on
Apr 20, 2018
Sold by
Kruse Todd A and Nahvi Jaleh A
Bought by
Garafola Michelle A and Maki Jeffrey M
Current Estimated Value
Home Financials for this Owner
Home Financials are based on the most recent Mortgage that was taken out on this home.
Original Mortgage
$431,000
Outstanding Balance
$370,653
Interest Rate
4.44%
Mortgage Type
New Conventional
Estimated Equity
$415,557
Purchase Details
Closed on
Jul 17, 2009
Sold by
Tjb Homes Inc
Bought by
Kruse Todd A and Nahvi Jaleh A
Home Financials for this Owner
Home Financials are based on the most recent Mortgage that was taken out on this home.
Original Mortgage
$417,000
Interest Rate
5.43%
Mortgage Type
New Conventional
Purchase Details
Closed on
Jan 6, 2009
Sold by
Igh Development Llc
Bought by
Tjb Homes Inc
Create a Home Valuation Report for This Property
The Home Valuation Report is an in-depth analysis detailing your home's value as well as a comparison with similar homes in the area
Home Values in the Area
Average Home Value in this Area
Purchase History
| Date | Buyer | Sale Price | Title Company |
|---|---|---|---|
| Garafola Michelle A | $575,000 | Burnet Title | |
| Kruse Todd A | $723,124 | -- | |
| Tjb Homes Inc | $140,000 | -- |
Source: Public Records
Mortgage History
| Date | Status | Borrower | Loan Amount |
|---|---|---|---|
| Open | Garafola Michelle A | $431,000 | |
| Previous Owner | Kruse Todd A | $417,000 |
Source: Public Records
Tax History Compared to Growth
Tax History
| Year | Tax Paid | Tax Assessment Tax Assessment Total Assessment is a certain percentage of the fair market value that is determined by local assessors to be the total taxable value of land and additions on the property. | Land | Improvement |
|---|---|---|---|---|
| 2024 | $7,698 | $743,600 | $200,200 | $543,400 |
| 2023 | $7,698 | $700,500 | $195,100 | $505,400 |
| 2022 | $7,766 | $720,200 | $197,900 | $522,300 |
| 2021 | $7,220 | $660,700 | $172,100 | $488,600 |
| 2020 | $6,700 | $611,600 | $163,900 | $447,700 |
| 2019 | $6,366 | $571,800 | $156,100 | $415,700 |
| 2018 | $6,285 | $515,800 | $148,600 | $367,200 |
| 2017 | $6,239 | $507,500 | $141,600 | $365,900 |
| 2016 | $6,520 | $491,900 | $134,900 | $357,000 |
| 2015 | $6,659 | $512,100 | $131,600 | $380,500 |
| 2014 | -- | $499,400 | $126,700 | $372,700 |
| 2013 | -- | $501,300 | $118,200 | $383,100 |
Source: Public Records
Map
Nearby Homes
- 8590 Corcoran Path
- 8550 Corcoran Path
- 8381 Corcoran Cir Unit 49
- 3853 90th St E
- 8355 Cooper Way
- 8104 Dana Path
- 8086 Dana Path
- 8336 Cloman Ave
- 8827 Coffman Path
- 7996 Corey Path
- 3750 80th St E
- TBd Cahill Blvd Blvd
- 8124 Clifford Cir
- 8361 Carew Ct
- 8770 Benson Way Unit 82
- 3944 76th Way E
- 3861 Conroy Trail
- 3295 80th St E Unit 508
- 13XX 3rd St
- 4049 75th St E
- 8723 Crimson Way
- 8717 Crimson Way
- 8723 Crismon Way
- 4118 87th St E
- 8732 Crimson Way
- 4098 4098 87th-Street-e
- 4098 87th St E
- 8733 Crismon Way
- 4078 87th St E
- 8714 Crismon Way
- 8706 Crimson Way
- 8706 Crismon Way
- 4060 87th St E
- 8732 Crismon Way
- 8691 Crismon Way
- 8680 Crimson Way
- 8769 Inver Grove Trail
- 4042 87th St E
- 4095 87th St E
- 8680 Crismon Way