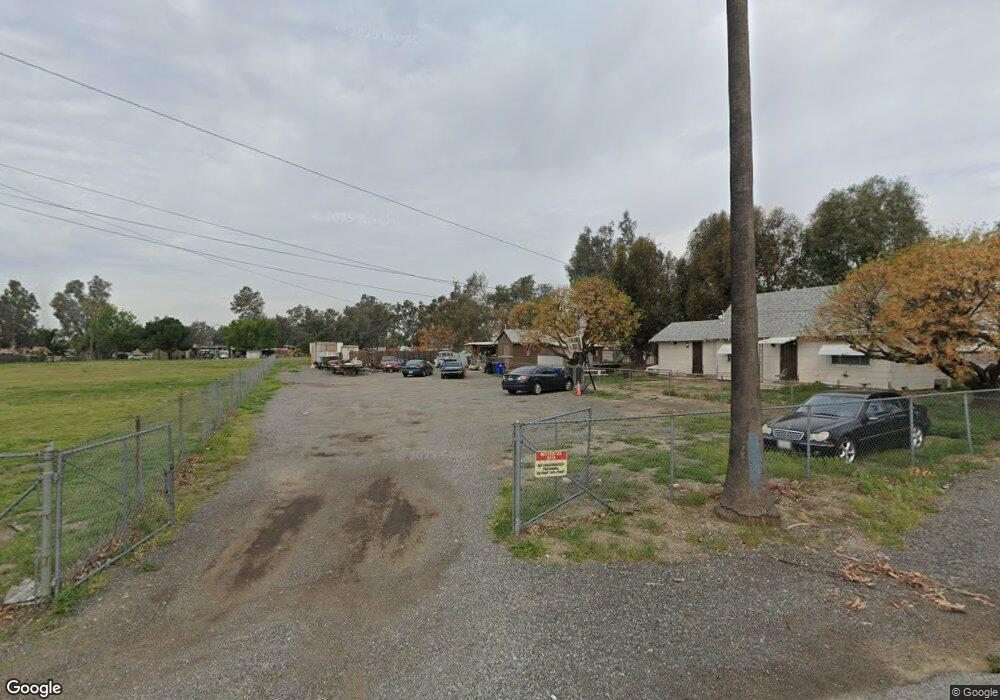
8718 Laurel Ave Fontana, CA 92335
Estimated Value: $524,000 - $699,117
2
Beds
2
Baths
1,144
Sq Ft
$532/Sq Ft
Est. Value
About This Home
This home is located at 8718 Laurel Ave, Fontana, CA 92335 and is currently estimated at $608,779, approximately $532 per square foot. 8718 Laurel Ave is a home located in San Bernardino County with nearby schools including Maple Elementary School, Alder Middle School, and Jurupa Hills High School.
Ownership History
Date
Name
Owned For
Owner Type
Purchase Details
Closed on
Jul 7, 2019
Sold by
Brandt Gary David and Brandt Barbara Alice
Bought by
Brandt Gary David and Brandt Barbara Alice
Current Estimated Value
Purchase Details
Closed on
Oct 17, 1994
Sold by
Reierson Judith Ann
Bought by
Hatheway Sara Mae
Purchase Details
Closed on
Oct 13, 1994
Sold by
Hatheway Kenneth Alan
Bought by
Hatheway Sara Mae
Purchase Details
Closed on
Oct 6, 1994
Sold by
George Sandra Lee and Parenteau Sandra Lee
Bought by
Hatheway Sara Mae
Purchase Details
Closed on
Oct 4, 1994
Sold by
Hatheway Sara Mae
Bought by
Hatheway Sara Mae and Sara Mae Hatheway Revocable Tr
Purchase Details
Closed on
May 16, 1994
Sold by
Parenteau Sandra Lee
Bought by
Hatheway Sara M
Purchase Details
Closed on
Apr 22, 1994
Sold by
Hatheway Kenneth Alan
Bought by
Hatheway Sara M
Purchase Details
Closed on
Apr 18, 1994
Sold by
Hatheway Wendy P
Bought by
Hatheway Sara M
Purchase Details
Closed on
Mar 28, 1994
Sold by
Reierson Judith Ann
Bought by
Hatheway Sara M
Create a Home Valuation Report for This Property
The Home Valuation Report is an in-depth analysis detailing your home's value as well as a comparison with similar homes in the area
Home Values in the Area
Average Home Value in this Area
Purchase History
| Date | Buyer | Sale Price | Title Company |
|---|---|---|---|
| Brandt Gary David | -- | None Available | |
| Hatheway Sara Mae | -- | -- | |
| Hatheway Sara Mae | -- | -- | |
| Hatheway Sara Mae | -- | -- | |
| Hatheway Sara Mae | -- | -- | |
| Hatheway Sara Mae | -- | -- | |
| Hatheway Sara M | -- | -- | |
| Hatheway Sara M | -- | -- | |
| Hatheway Sara M | -- | -- | |
| Hatheway Sara M | -- | -- |
Source: Public Records
Tax History Compared to Growth
Tax History
| Year | Tax Paid | Tax Assessment Tax Assessment Total Assessment is a certain percentage of the fair market value that is determined by local assessors to be the total taxable value of land and additions on the property. | Land | Improvement |
|---|---|---|---|---|
| 2025 | $1,735 | $165,053 | $115,289 | $49,764 |
| 2024 | $1,735 | $161,816 | $113,028 | $48,788 |
| 2023 | $1,691 | $158,643 | $110,812 | $47,831 |
| 2022 | $1,684 | $155,532 | $108,639 | $46,893 |
| 2021 | $1,663 | $152,483 | $106,509 | $45,974 |
| 2020 | $1,659 | $150,920 | $105,417 | $45,503 |
| 2019 | $1,609 | $147,961 | $103,350 | $44,611 |
| 2018 | $1,633 | $145,060 | $101,324 | $43,736 |
| 2017 | $1,624 | $142,215 | $99,337 | $42,878 |
| 2016 | $1,598 | $139,426 | $97,389 | $42,037 |
| 2015 | $1,577 | $137,332 | $95,926 | $41,406 |
| 2014 | $1,579 | $134,642 | $94,047 | $40,595 |
Source: Public Records
Map
Nearby Homes
- 17962 Merrill Ave
- 8560 Buckeye Dr
- 8795 Frankfort St
- 18013 Arrow Blvd
- 17626 Orange Ct
- 8787 Locust Ave Unit 82
- 18239 Orange Way
- 18100 Arrow Blvd
- 9154 Laurel Ave
- 17721 Upland Ave
- 17754 Upland Ave
- 17425 Arrow Blvd Unit 8
- 9050 Dumond Dr
- Newbridge Plan at Summit Park - Paloma
- Niagra Plan at Summit Park - Paloma
- 3544 E Aurora Dr
- 3528 E Aurora Dr
- Nigel Plan at Summit Park - Paloma
- Ballard Plan at Summit Park - Aurora
- Barbara Plan at Summit Park - Aurora
- 8740 Laurel Ave
- 8688 Laurel Ave
- 17904 Ceres Ave
- 8764 Laurel Ave
- 17901 Ceres Ave
- 17827 Dorsey Way
- 8670 Laurel Ave
- 17905 Orange Way
- 17918 Ceres Ave
- 17915 Ceres Ave
- 17855 Dorsey Way
- 17902 Citron Ave
- 17913 Orange Way
- 8796 Laurel Ave
- 17930 Ceres Ave
- 17844 Citron Ave
- 17843 Dorsey Way
- 17874 Citron Ave
- 17864 Citron Ave
- 17854 Citron Ave