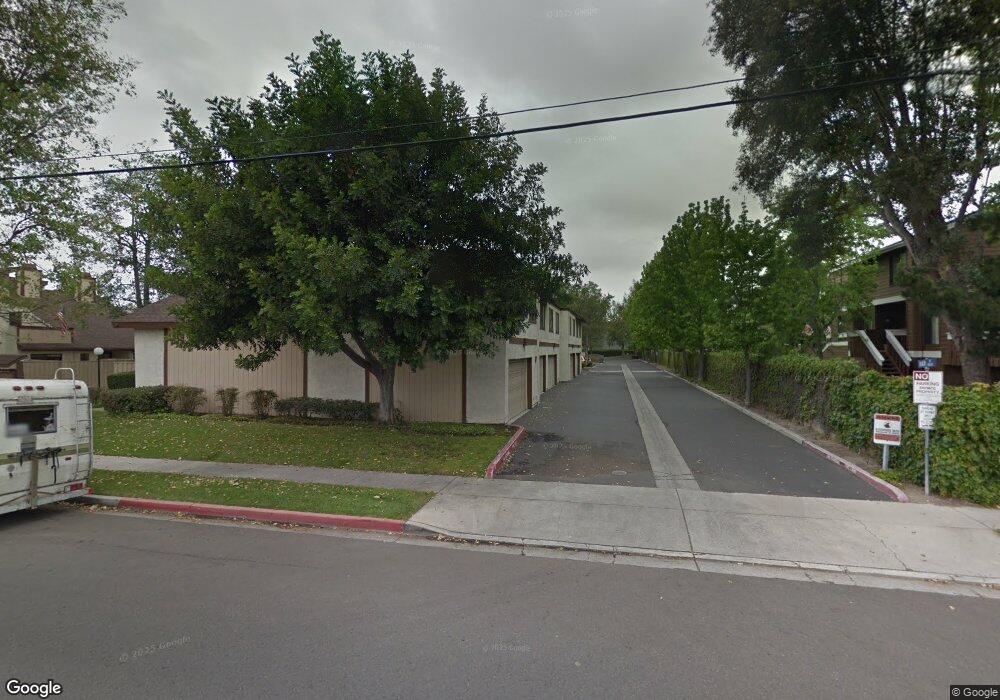
8718 Mar Dr Unit 14 Garden Grove, CA 92844
Estimated Value: $672,000 - $880,000
3
Beds
2
Baths
1,350
Sq Ft
$544/Sq Ft
Est. Value
About This Home
This home is located at 8718 Mar Dr Unit 14, Garden Grove, CA 92844 and is currently estimated at $735,004, approximately $544 per square foot. 8718 Mar Dr Unit 14 is a home located in Orange County with nearby schools including Meairs Elementary School, Warner Middle, and Westminster High School.
Ownership History
Date
Name
Owned For
Owner Type
Purchase Details
Closed on
Mar 1, 2012
Sold by
Sanchez Julio C
Bought by
Sanchez Julio C
Current Estimated Value
Home Financials for this Owner
Home Financials are based on the most recent Mortgage that was taken out on this home.
Original Mortgage
$195,000
Outstanding Balance
$134,270
Interest Rate
3.92%
Mortgage Type
New Conventional
Estimated Equity
$600,734
Purchase Details
Closed on
Aug 28, 2005
Sold by
Sanchez Julio C and Magallanes Eva
Bought by
Sanchez Julio C
Purchase Details
Closed on
Mar 3, 2000
Sold by
Theodore Miller and Oliveri Doreen Oliveri
Bought by
Sanchez Julio C and Magallanes Eva
Home Financials for this Owner
Home Financials are based on the most recent Mortgage that was taken out on this home.
Original Mortgage
$160,500
Interest Rate
8.26%
Mortgage Type
FHA
Purchase Details
Closed on
Sep 24, 1997
Sold by
Carmine Oliveri and Carmine Theresa Oliveri
Bought by
Miller Theodore and Miller Doreen Oliveri
Create a Home Valuation Report for This Property
The Home Valuation Report is an in-depth analysis detailing your home's value as well as a comparison with similar homes in the area
Home Values in the Area
Average Home Value in this Area
Purchase History
| Date | Buyer | Sale Price | Title Company |
|---|---|---|---|
| Sanchez Julio C | -- | Orange Coast Title Lender Se | |
| Sanchez Julio C | -- | -- | |
| Sanchez Julio C | $168,500 | American Title Co | |
| Miller Theodore | -- | -- |
Source: Public Records
Mortgage History
| Date | Status | Borrower | Loan Amount |
|---|---|---|---|
| Open | Sanchez Julio C | $195,000 | |
| Closed | Sanchez Julio C | $160,500 |
Source: Public Records
Tax History Compared to Growth
Tax History
| Year | Tax Paid | Tax Assessment Tax Assessment Total Assessment is a certain percentage of the fair market value that is determined by local assessors to be the total taxable value of land and additions on the property. | Land | Improvement |
|---|---|---|---|---|
| 2025 | $3,360 | $258,970 | $119,474 | $139,496 |
| 2024 | $3,360 | $253,893 | $117,132 | $136,761 |
| 2023 | $3,248 | $248,915 | $114,835 | $134,080 |
| 2022 | $3,195 | $244,035 | $112,584 | $131,451 |
| 2021 | $3,128 | $239,250 | $110,376 | $128,874 |
| 2020 | $3,090 | $236,797 | $109,244 | $127,553 |
| 2019 | $3,054 | $232,154 | $107,102 | $125,052 |
| 2018 | $3,046 | $227,602 | $105,002 | $122,600 |
| 2017 | $2,936 | $223,140 | $102,943 | $120,197 |
| 2016 | $2,825 | $218,765 | $100,924 | $117,841 |
| 2015 | $2,775 | $215,479 | $99,408 | $116,071 |
| 2014 | $2,712 | $211,259 | $97,461 | $113,798 |
Source: Public Records
Map
Nearby Homes
- 13175 Creek View Dr Unit F
- 13252 Newland St Unit A-D
- 8520 Lake Knoll Ave Unit B
- 8833 Brookdale Dr
- 8800 W Garden Grove Blvd Unit 2
- 13411 Magnolia St
- 13392 Magnolia St
- 8442 Trask Ave
- 12941 Josephine St
- 12931 Josephine St
- 12892 Adelle St
- 13082 Monroe St
- 13782 Newland St
- 13402 Wynant Dr
- 13141 Monroe St
- 8784 Hewitt Place Unit 12
- 8197 Jasmine Ave
- 12861 Alamitos Way
- 13839 Magnolia St
- 9370 W Garden Grove Blvd
- 8719 Marina Way Unit 5
- 8731 Marina Way Unit 1
- 8728 Mar Dr Unit 18
- 8724 Mar Dr Unit 17
- 8721 Marina Way Unit 4
- 8717 Marina Way Unit 6
- 8720 Mar Dr Unit 15
- 8711 Marina Way Unit 8
- 8731 Marina Way
- 8701 Marina Way Unit 13
- 8719 Marina Way
- 8728 Mar Dr
- 8727 Marina Way
- 8709 Marina Way Unit 9
- 8715 Marina Way Unit 7
- 8722 Mar Dr
- 8723 Marina Way Unit 3
- 8707 Marina Way Unit 10B
- 8709 Marina Way
- 8705 Marina Way Unit 11