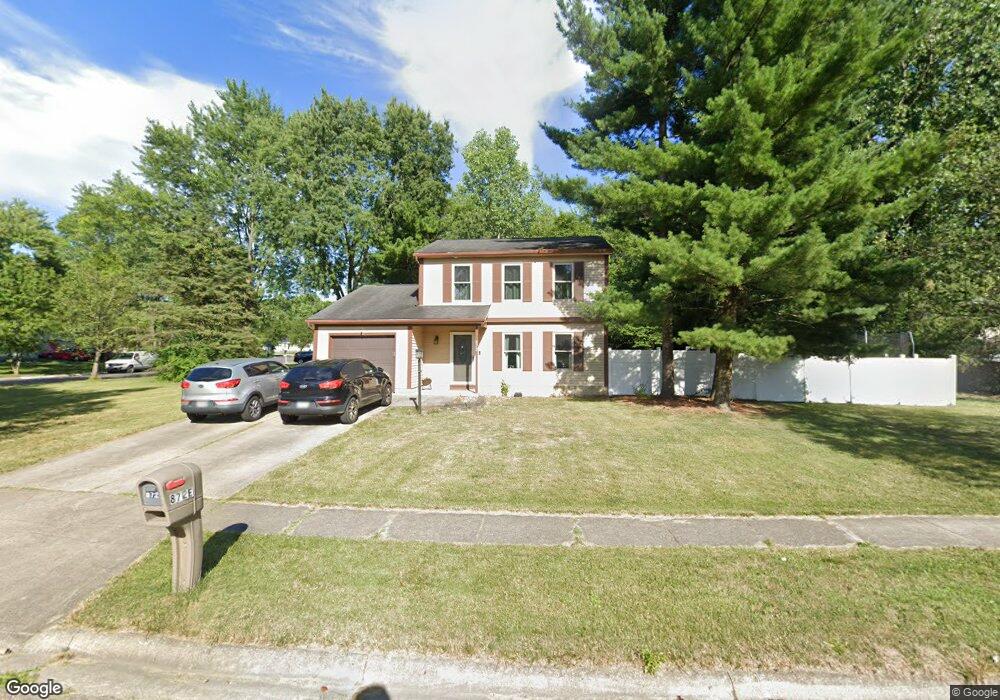
872 Humboldt Dr E Columbus, OH 43230
Woodside Green NeighborhoodEstimated Value: $340,027 - $366,000
3
Beds
2
Baths
1,428
Sq Ft
$244/Sq Ft
Est. Value
About This Home
This home is located at 872 Humboldt Dr E, Columbus, OH 43230 and is currently estimated at $348,257, approximately $243 per square foot. 872 Humboldt Dr E is a home located in Franklin County with nearby schools including Chapelfield Elementary School, Gahanna West Middle School, and Lincoln High School.
Ownership History
Date
Name
Owned For
Owner Type
Purchase Details
Closed on
Apr 13, 2020
Sold by
Klopfer Scott A and Klopfer Tamara R
Bought by
Smith Ashlyn E and Moss Kyle W
Current Estimated Value
Purchase Details
Closed on
Apr 30, 1996
Sold by
Owrey Ladonna A
Bought by
Klopfer Scott A and Klopfer Tamara R
Home Financials for this Owner
Home Financials are based on the most recent Mortgage that was taken out on this home.
Original Mortgage
$95,350
Interest Rate
7.91%
Mortgage Type
New Conventional
Purchase Details
Closed on
Jun 1, 1983
Create a Home Valuation Report for This Property
The Home Valuation Report is an in-depth analysis detailing your home's value as well as a comparison with similar homes in the area
Home Values in the Area
Average Home Value in this Area
Purchase History
| Date | Buyer | Sale Price | Title Company |
|---|---|---|---|
| Smith Ashlyn E | $225,900 | Clean Title Agency Inc | |
| Klopfer Scott A | $98,300 | -- | |
| -- | $60,300 | -- |
Source: Public Records
Mortgage History
| Date | Status | Borrower | Loan Amount |
|---|---|---|---|
| Previous Owner | Klopfer Scott A | $95,350 |
Source: Public Records
Tax History Compared to Growth
Tax History
| Year | Tax Paid | Tax Assessment Tax Assessment Total Assessment is a certain percentage of the fair market value that is determined by local assessors to be the total taxable value of land and additions on the property. | Land | Improvement |
|---|---|---|---|---|
| 2024 | $5,578 | $94,680 | $33,390 | $61,290 |
| 2023 | $5,508 | $94,675 | $33,390 | $61,285 |
| 2022 | $5,192 | $69,520 | $18,240 | $51,280 |
| 2021 | $5,021 | $69,520 | $18,240 | $51,280 |
| 2020 | $4,533 | $63,290 | $18,240 | $45,050 |
| 2019 | $3,818 | $53,200 | $15,190 | $38,010 |
| 2018 | $3,618 | $53,200 | $15,190 | $38,010 |
| 2017 | $3,474 | $53,200 | $15,190 | $38,010 |
| 2016 | $3,443 | $47,600 | $15,330 | $32,270 |
| 2015 | $3,446 | $47,600 | $15,330 | $32,270 |
| 2014 | $3,419 | $47,600 | $15,330 | $32,270 |
| 2013 | $1,698 | $47,600 | $15,330 | $32,270 |
Source: Public Records
Map
Nearby Homes
- 638 Thistle Ave
- 459 Bluestem Ave
- 536 Springwood Lake Dr
- 3544 Halpern St
- 402 Bluestem Ave
- 3150 Berkley Pointe Dr
- 3555 Tami Place
- 0 Wendler Blvd
- 3118 Berkley Pointe Dr
- 3877 Hines Rd
- 642 Ridenour Rd
- 111 Nob Hill Dr N
- 388 Elkwood Place
- 108 Walcreek Dr W
- 3715 Montclair Dr
- 3707 Montclair Dr
- 4125 Emerius Dr
- 2741 Acarie Dr
- 200 Glenhurst Ct
- 343 Amesbury Dr
- 531 Forestwood Dr
- 555 Forestwood Dr
- 540 Humboldt Ct
- 523 Forestwood Dr
- 863 Humboldt Dr E
- 530 Humboldt Ct
- 855 Humboldt Dr E
- 563 Forestwood Dr
- 0 Forestwood Dr Unit Lot 2
- 0 Forestwood Dr Unit Lot 1
- 532 Forestwood Dr
- 540 Forestwood Dr
- 501 Forestwood Dr
- 524 Forestwood Dr
- 548 Forestwood Dr
- 847 Humboldt Dr E
- 520 Humboldt Ct
- 504 Forestwood Dr
- 813 Lindenhaven Ct
- 872 Humboldt Dr W