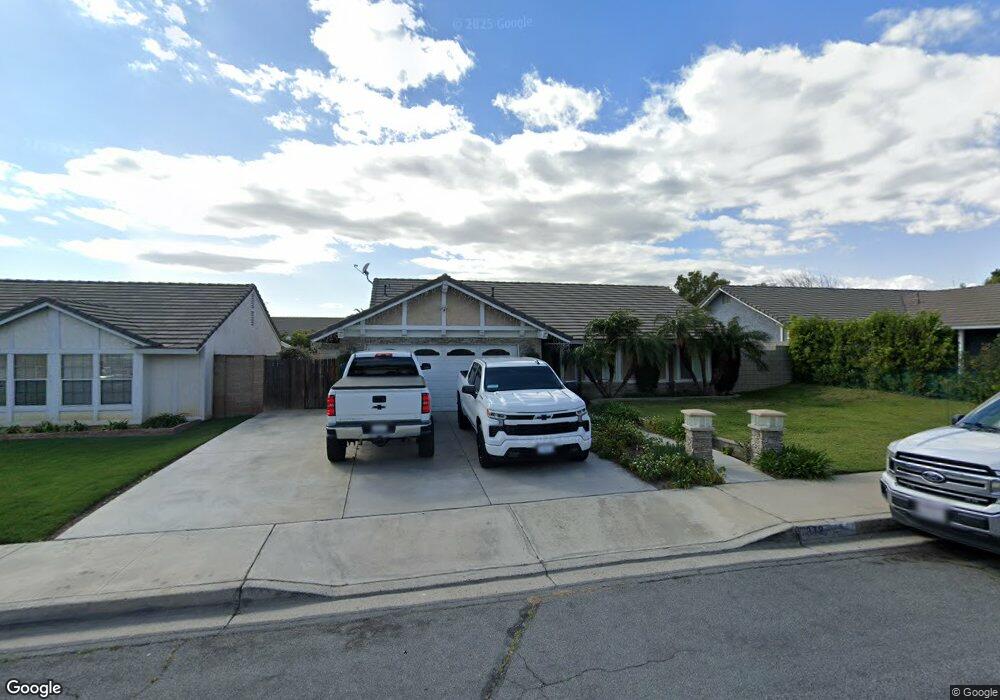
872 N Aspen Ave Rialto, CA 92376
Estimated Value: $573,000 - $619,000
4
Beds
2
Baths
1,508
Sq Ft
$396/Sq Ft
Est. Value
About This Home
This home is located at 872 N Aspen Ave, Rialto, CA 92376 and is currently estimated at $597,686, approximately $396 per square foot. 872 N Aspen Ave is a home located in San Bernardino County with nearby schools including Helen L. Dollahan Elementary School, Ethel Kucera Middle School, and Wilmer Amina Carter High School.
Ownership History
Date
Name
Owned For
Owner Type
Purchase Details
Closed on
Sep 18, 2006
Sold by
Rader Sonya
Bought by
Rader James
Current Estimated Value
Home Financials for this Owner
Home Financials are based on the most recent Mortgage that was taken out on this home.
Original Mortgage
$291,000
Outstanding Balance
$173,228
Interest Rate
6.51%
Mortgage Type
New Conventional
Estimated Equity
$424,458
Purchase Details
Closed on
Aug 24, 2005
Sold by
Radar Sonya
Bought by
Rader James
Home Financials for this Owner
Home Financials are based on the most recent Mortgage that was taken out on this home.
Original Mortgage
$251,000
Interest Rate
6.88%
Mortgage Type
New Conventional
Purchase Details
Closed on
Aug 15, 2001
Sold by
Wilson Earl
Bought by
Rader James and Rader Sonya
Home Financials for this Owner
Home Financials are based on the most recent Mortgage that was taken out on this home.
Original Mortgage
$134,351
Interest Rate
6.9%
Mortgage Type
FHA
Create a Home Valuation Report for This Property
The Home Valuation Report is an in-depth analysis detailing your home's value as well as a comparison with similar homes in the area
Home Values in the Area
Average Home Value in this Area
Purchase History
| Date | Buyer | Sale Price | Title Company |
|---|---|---|---|
| Rader James | -- | First American Title Co | |
| Rader James | -- | First American Title Company | |
| Rader James | $136,500 | Fidelity National Title Ins |
Source: Public Records
Mortgage History
| Date | Status | Borrower | Loan Amount |
|---|---|---|---|
| Open | Rader James | $291,000 | |
| Closed | Rader James | $251,000 | |
| Previous Owner | Rader James | $134,351 |
Source: Public Records
Tax History Compared to Growth
Tax History
| Year | Tax Paid | Tax Assessment Tax Assessment Total Assessment is a certain percentage of the fair market value that is determined by local assessors to be the total taxable value of land and additions on the property. | Land | Improvement |
|---|---|---|---|---|
| 2025 | $3,129 | $220,961 | $50,322 | $170,639 |
| 2024 | $3,129 | $216,628 | $49,335 | $167,293 |
| 2023 | $3,296 | $212,381 | $48,368 | $164,013 |
| 2022 | $3,055 | $208,217 | $47,420 | $160,797 |
| 2021 | $3,037 | $204,134 | $46,490 | $157,644 |
| 2020 | $3,043 | $202,041 | $46,013 | $156,028 |
| 2019 | $2,980 | $198,080 | $45,111 | $152,969 |
| 2018 | $2,881 | $194,196 | $44,226 | $149,970 |
| 2017 | $2,860 | $190,388 | $43,359 | $147,029 |
| 2016 | $2,827 | $186,655 | $42,509 | $144,146 |
| 2015 | $3,068 | $183,851 | $41,870 | $141,981 |
| 2014 | $3,159 | $180,250 | $41,050 | $139,200 |
Source: Public Records
Map
Nearby Homes
- 1670 Phantom Ln
- 1150 Thunderchief Ln
- 1333 Yeager Ave
- 1142 Thunderchief Ln
- 1668 Phantom Ln
- 1660 Phantom Ln
- 1702 Eagle Rd
- 1152 Thunderchief Ln
- 1701 Eagle Rd
- 1254 Yeager Ave
- 1642 Eagle Rd
- 1641 Eagle Rd
- 1355 Yeager Ave
- 1103 Thunderchief Ln
- 1710 Eagle Rd
- 1706 Eagle Rd
- 1216 Yeager Ave
- 1220 Yeager Ave
- 1664 Phantom Ln
- 1658 Phantom Ln
- 860 N Aspen Ave
- 888 N Aspen Ave
- 871 N Smoke Tree Ave
- 859 N Smoke Tree Ave
- 887 N Smoke Tree Ave
- 850 N Aspen Ave
- 850 N Aspen Ave
- 904 N Aspen Ave
- 871 N Aspen Ave
- 909 N Smoke Tree Ave
- 887 N Aspen Ave
- 855 N Smoke Tree Ave
- 859 N Aspen Ave
- 859 N Aspen Ave
- 846 N Aspen Ave
- 918 N Aspen Ave
- 907 N Aspen Ave
- 849 N Aspen Ave
- 921 N Smoke Tree Ave
- 1357 W Holly St