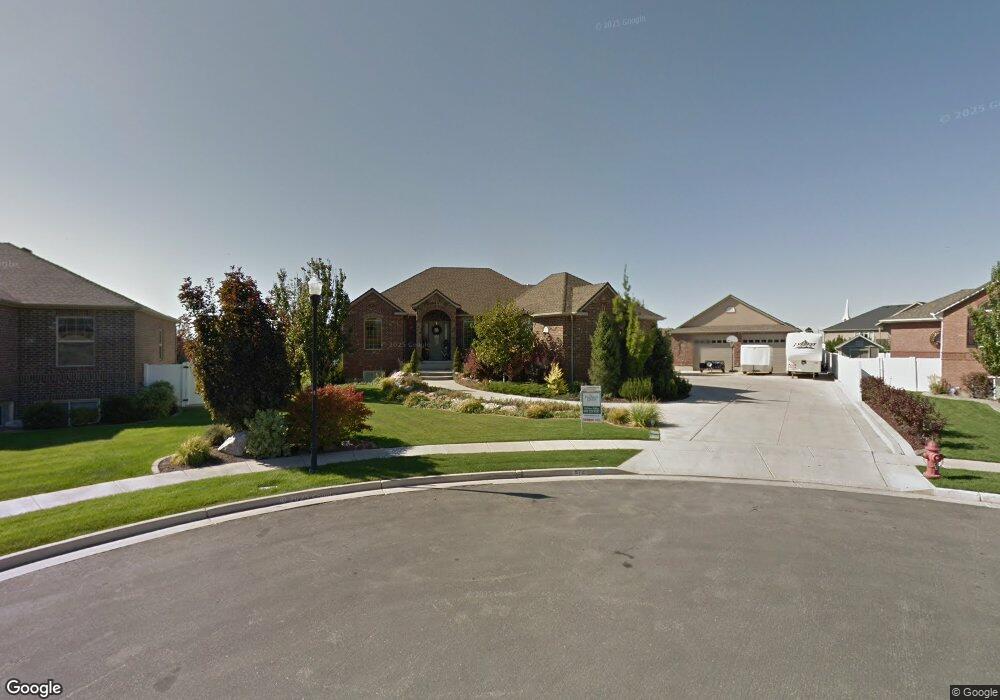
872 S 2450 W Syracuse, UT 84075
Estimated Value: $926,000 - $1,462,000
5
Beds
5
Baths
6,126
Sq Ft
$207/Sq Ft
Est. Value
About This Home
This home is located at 872 S 2450 W, Syracuse, UT 84075 and is currently estimated at $1,267,492, approximately $206 per square foot. 872 S 2450 W is a home located in Davis County with nearby schools including Syracuse Elementary School, Syracuse Junior High School, and Syracuse High School.
Ownership History
Date
Name
Owned For
Owner Type
Purchase Details
Closed on
Feb 18, 2010
Sold by
Nelson Ron L and Nelson Kerry
Bought by
Nelson Kerry and Nelson Ronald L
Current Estimated Value
Home Financials for this Owner
Home Financials are based on the most recent Mortgage that was taken out on this home.
Original Mortgage
$150,000
Outstanding Balance
$99,225
Interest Rate
5.02%
Mortgage Type
New Conventional
Estimated Equity
$1,168,267
Purchase Details
Closed on
Aug 16, 2005
Sold by
Nelson Ron L and Nelson Kerry
Bought by
Nelson Kerry and Nelson Ronald I
Purchase Details
Closed on
Feb 24, 2003
Sold by
Nelson Ron L
Bought by
Nelson Ron L and Nelson Kerry
Home Financials for this Owner
Home Financials are based on the most recent Mortgage that was taken out on this home.
Original Mortgage
$195,000
Interest Rate
5.93%
Mortgage Type
New Conventional
Purchase Details
Closed on
Sep 12, 2002
Sold by
Benchmark Real Estate Company
Bought by
Nelson Ron L and Nelson Kerry
Create a Home Valuation Report for This Property
The Home Valuation Report is an in-depth analysis detailing your home's value as well as a comparison with similar homes in the area
Home Values in the Area
Average Home Value in this Area
Purchase History
| Date | Buyer | Sale Price | Title Company |
|---|---|---|---|
| Nelson Kerry | -- | Bonneville Superior Titl | |
| Nelson Ron L | -- | Bonneville Superior T | |
| Nelson Kerry | -- | -- | |
| Nelson Ron L | -- | Bonneville Title Company Inc | |
| Nelson Ron L | -- | Bonneville Title Company Inc | |
| Nelson Ron L | -- | Founders Title Co |
Source: Public Records
Mortgage History
| Date | Status | Borrower | Loan Amount |
|---|---|---|---|
| Open | Nelson Ron L | $150,000 | |
| Closed | Nelson Ron L | $195,000 |
Source: Public Records
Tax History
| Year | Tax Paid | Tax Assessment Tax Assessment Total Assessment is a certain percentage of the fair market value that is determined by local assessors to be the total taxable value of land and additions on the property. | Land | Improvement |
|---|---|---|---|---|
| 2025 | $7,810 | $753,500 | $141,965 | $611,535 |
| 2024 | $7,570 | $735,350 | $135,956 | $599,394 |
| 2023 | $6,695 | $1,185,000 | $188,300 | $996,700 |
| 2022 | $6,445 | $625,350 | $105,706 | $519,644 |
| 2021 | $5,453 | $819,000 | $158,421 | $660,579 |
| 2020 | $5,075 | $738,000 | $128,505 | $609,495 |
| 2019 | $5,127 | $736,000 | $144,189 | $591,811 |
| 2018 | $4,716 | $672,000 | $132,517 | $539,483 |
| 2016 | $4,439 | $331,705 | $50,415 | $281,290 |
| 2015 | $3,987 | $283,745 | $50,415 | $233,330 |
| 2014 | $3,730 | $270,513 | $50,415 | $220,098 |
| 2013 | -- | $238,890 | $44,476 | $194,414 |
Source: Public Records
Map
Nearby Homes
- 2584 S 2430 St W Unit 502
- 2613 S 2430 W Unit 111
- 2614 S 2430 W Unit 106
- 2665 S 2430 W Unit 118
- 2885 W 700 S
- 2935 W 1200 S
- 712 S 1750 W
- 4205 W 1100 S
- 2799 W 100 S
- 2809 W 100 S
- 937 S 1600 W
- 2679 W Antelope Dr
- 39 S 2000 W
- 2329 W 1700 S
- 552 S 1525 W
- 1240 S 1575 W
- 12 N 2000 W Unit 1
- 82 N 2875 W
- 1872 S 2265 W
- 1115 S 1425 W
Your Personal Tour Guide
Ask me questions while you tour the home.