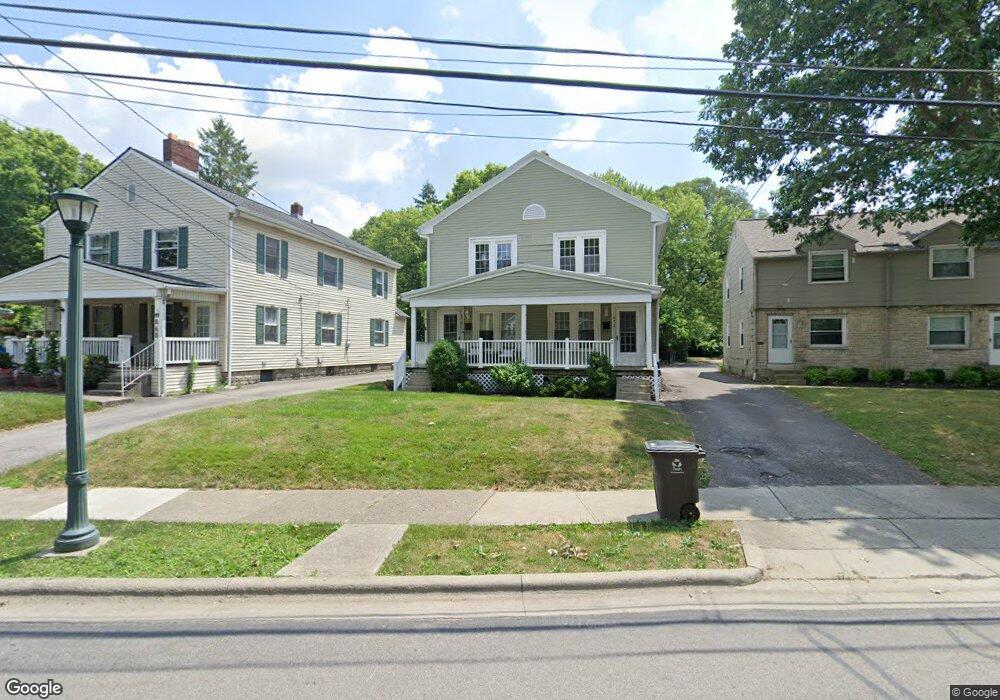
872 Sheridan Ave Bexley, OH 43209
Estimated Value: $362,672 - $404,000
4
Beds
2
Baths
2,240
Sq Ft
$171/Sq Ft
Est. Value
About This Home
This home is located at 872 Sheridan Ave, Bexley, OH 43209 and is currently estimated at $382,168, approximately $170 per square foot. 872 Sheridan Ave is a home located in Franklin County with nearby schools including Montrose Elementary School, Bexley Middle School, and Bexley High School.
Ownership History
Date
Name
Owned For
Owner Type
Purchase Details
Closed on
Dec 30, 2005
Sold by
Stepro J William and Stepro Marilyn Ann
Bought by
Stepro Marilyn Ann and Marilyn Ann Stepro Trust
Current Estimated Value
Purchase Details
Closed on
Jul 27, 2001
Sold by
Jackson Brian A
Bought by
Stepro J William and Stepro Marilyn A
Purchase Details
Closed on
Sep 28, 2000
Sold by
Northup Joy and Northup Joyce E
Bought by
Jackson Brian A
Purchase Details
Closed on
Jan 4, 1999
Sold by
B & J Investment Co
Bought by
Northup Joy and Northup Joyce E
Home Financials for this Owner
Home Financials are based on the most recent Mortgage that was taken out on this home.
Original Mortgage
$97,444
Interest Rate
6.83%
Mortgage Type
FHA
Purchase Details
Closed on
Jun 28, 1984
Bought by
Jaeger William M
Create a Home Valuation Report for This Property
The Home Valuation Report is an in-depth analysis detailing your home's value as well as a comparison with similar homes in the area
Home Values in the Area
Average Home Value in this Area
Purchase History
| Date | Buyer | Sale Price | Title Company |
|---|---|---|---|
| Stepro Marilyn Ann | -- | None Available | |
| Stepro J William | $139,900 | -- | |
| Jackson Brian A | $95,300 | Transohio Title | |
| Northup Joy | $97,500 | -- | |
| B & J Investment Co | -- | -- | |
| Jaeger William M | $42,500 | -- |
Source: Public Records
Mortgage History
| Date | Status | Borrower | Loan Amount |
|---|---|---|---|
| Previous Owner | Northup Joy | $97,444 |
Source: Public Records
Tax History Compared to Growth
Tax History
| Year | Tax Paid | Tax Assessment Tax Assessment Total Assessment is a certain percentage of the fair market value that is determined by local assessors to be the total taxable value of land and additions on the property. | Land | Improvement |
|---|---|---|---|---|
| 2024 | $5,857 | $103,470 | $29,860 | $73,610 |
| 2023 | $5,277 | $103,460 | $29,855 | $73,605 |
| 2022 | $4,456 | $70,180 | $13,090 | $57,090 |
| 2021 | $4,459 | $70,180 | $13,090 | $57,090 |
| 2020 | $4,421 | $70,180 | $13,090 | $57,090 |
| 2019 | $4,188 | $58,490 | $10,920 | $47,570 |
| 2018 | $3,940 | $58,490 | $10,920 | $47,570 |
| 2017 | $3,569 | $58,490 | $10,920 | $47,570 |
| 2016 | $4,213 | $63,080 | $13,340 | $49,740 |
| 2015 | $4,228 | $63,080 | $13,340 | $49,740 |
| 2014 | $4,252 | $63,080 | $13,340 | $49,740 |
| 2013 | $2,105 | $60,060 | $12,705 | $47,355 |
Source: Public Records
Map
Nearby Homes
- 866-868 Sheridan Ave
- 945 Francis Ave
- 849 Lyman Ave
- 563 S Dawson Ave
- 905 Vernon Rd
- 891 Vernon Rd
- 782 S Remington Rd
- 2424 Sherwood Rd
- 592 Rhoads Ave Unit 594
- 2425 Bryden Rd
- 1751 Bide A Wee Park Ave
- 1052 S Roosevelt Ave
- 895 Grandon Ave
- 419 Westland Ave
- 1800 E Fulton St
- 696 Vernon Rd
- 751 Bulen Ave
- 572 Bulen Ave
- 639 Bulen Ave
- 2564 Sherwood Rd
- 870 Sheridan Ave Unit 72
- 866 Sheridan Ave Unit 68
- 876 Sheridan Ave
- 876 Sheridan Ave Unit 878
- 876-878 Sheridan Ave
- 862 Sheridan Ave
- 882 Sheridan Ave Unit 84
- 856 Sheridan Ave
- 875 Sheridan Ave
- 850 Sheridan Ave
- 871 Sheridan Ave
- 873 Sheridan Ave Unit 875
- 861 Sheridan Ave
- 869 College Ave
- 875 College Ave
- 889 Sheridan Ave
- 865 College Ave
- 840 Sheridan Ave
- 857 Sheridan Ave
- 859 College Ave