Estimated Value: $1,039,000 - $1,251,000
3
Beds
2
Baths
1,791
Sq Ft
$621/Sq Ft
Est. Value
About This Home
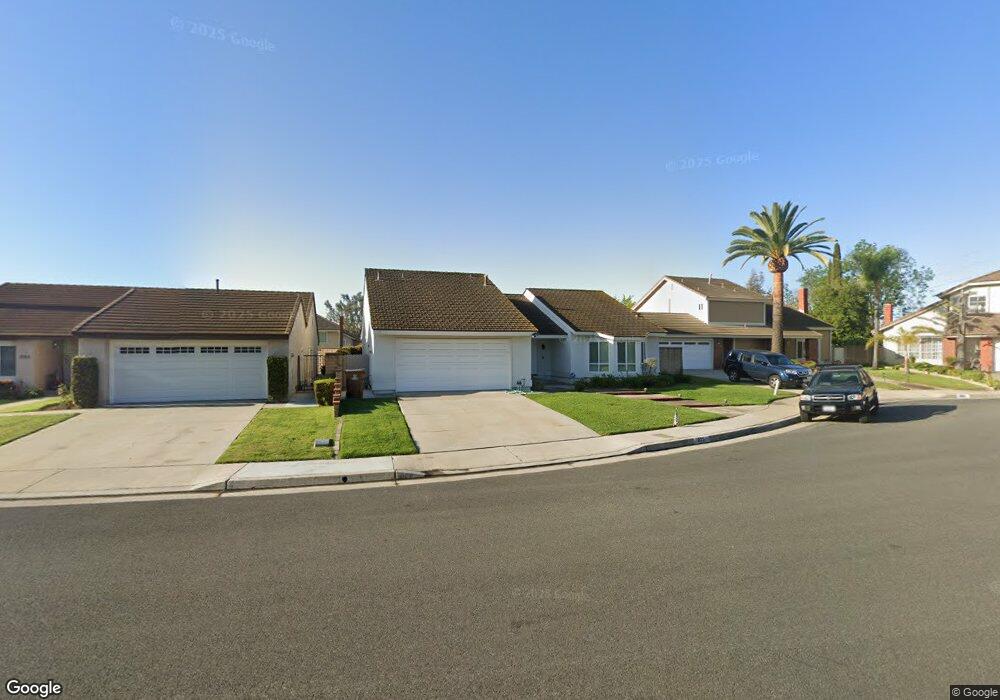
This home is located at 872 Vista Cir, Brea, CA 92821 and is currently estimated at $1,111,586, approximately $620 per square foot. 872 Vista Cir is a home located in Orange County with nearby schools including Mariposa Elementary School, Brea Junior High School, and Brea-Olinda High School.
Ownership History
Date
Name
Owned For
Owner Type
Purchase Details
Closed on
Jan 22, 2021
Sold by
Shprcher Ziona
Bought by
Shprcher Ziona and Ziona Shprecher Trust
Current Estimated Value
Home Financials for this Owner
Home Financials are based on the most recent Mortgage that was taken out on this home.
Original Mortgage
$200,000
Outstanding Balance
$178,154
Interest Rate
2.6%
Mortgage Type
Purchase Money Mortgage
Estimated Equity
$933,432
Purchase Details
Closed on
Mar 27, 2015
Sold by
Shprecher Ziona
Bought by
Shprecher Ziona and Ziona Shprecher Trust
Purchase Details
Closed on
Oct 6, 1998
Sold by
Radford Evans Douglas
Bought by
Shprecher Ziona
Home Financials for this Owner
Home Financials are based on the most recent Mortgage that was taken out on this home.
Original Mortgage
$227,150
Interest Rate
6.54%
Create a Home Valuation Report for This Property
The Home Valuation Report is an in-depth analysis detailing your home's value as well as a comparison with similar homes in the area
Home Values in the Area
Average Home Value in this Area
Purchase History
| Date | Buyer | Sale Price | Title Company |
|---|---|---|---|
| Shprcher Ziona | -- | Accommodation | |
| Shprecher Ziona | -- | Provident Title Company | |
| Shprecher Ziona | -- | None Available | |
| Shprecher Ziona | $272,500 | North American Title Co |
Source: Public Records
Mortgage History
| Date | Status | Borrower | Loan Amount |
|---|---|---|---|
| Open | Shprecher Ziona | $200,000 | |
| Previous Owner | Shprecher Ziona | $227,150 |
Source: Public Records
Tax History
| Year | Tax Paid | Tax Assessment Tax Assessment Total Assessment is a certain percentage of the fair market value that is determined by local assessors to be the total taxable value of land and additions on the property. | Land | Improvement |
|---|---|---|---|---|
| 2025 | $4,924 | $427,193 | $265,914 | $161,279 |
| 2024 | $4,924 | $418,817 | $260,700 | $158,117 |
| 2023 | $4,787 | $410,605 | $255,588 | $155,017 |
| 2022 | $4,738 | $402,554 | $250,576 | $151,978 |
| 2021 | $4,649 | $394,661 | $245,662 | $148,999 |
| 2020 | $4,618 | $390,615 | $243,143 | $147,472 |
| 2019 | $4,496 | $382,956 | $238,375 | $144,581 |
| 2018 | $4,428 | $375,448 | $233,701 | $141,747 |
| 2017 | $4,344 | $368,087 | $229,119 | $138,968 |
| 2016 | $4,258 | $360,870 | $224,626 | $136,244 |
| 2015 | $4,198 | $355,450 | $221,252 | $134,198 |
| 2014 | -- | $348,488 | $216,918 | $131,570 |
Source: Public Records
Map
Nearby Homes
- 846 Mooncrest Cir
- 958 Baxter Pkwy
- 1051 Site Dr Unit 236
- 1051 Site Dr Unit 255
- 1051 Site Dr Unit 25
- 1051 Site Dr Unit 251
- 856 Williams St
- 1020 Joyce Dr
- 1446 Beechwood Dr
- 1401 Havenhurst Dr
- 900 De Jur St
- 1308 Las Lomas Dr
- 1142 Delay St
- 736 Knoll Lake Dr Unit 266
- 448 W Central Ave
- 1011 Delay St
- 1163 Delay St
- 530 Palermo Way
- 753 Site Dr
- 1445 Arrow Wood Dr
Your Personal Tour Guide
Ask me questions while you tour the home.