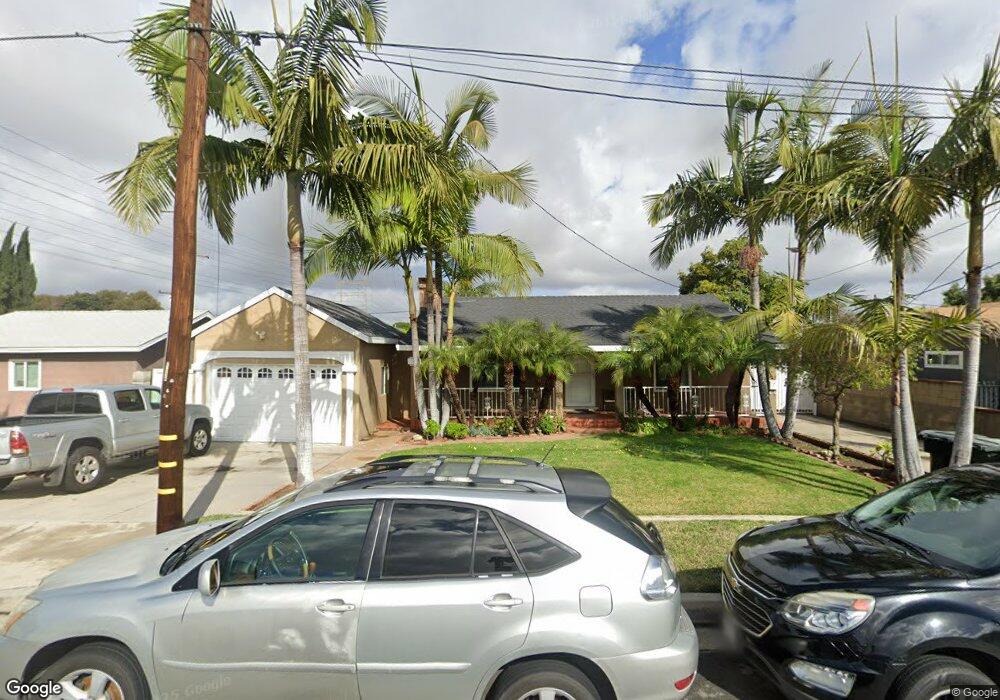
8721 Dunbar St Bellflower, CA 90706
Estimated Value: $755,000 - $923,000
3
Beds
2
Baths
1,642
Sq Ft
$509/Sq Ft
Est. Value
About This Home
This home is located at 8721 Dunbar St, Bellflower, CA 90706 and is currently estimated at $836,342, approximately $509 per square foot. 8721 Dunbar St is a home located in Los Angeles County with nearby schools including Jefferson Elementary School, Alondra Middle School, and Paramount High School.
Ownership History
Date
Name
Owned For
Owner Type
Purchase Details
Closed on
Jul 11, 2002
Sold by
Moran Guadalupe and Moran Ana E
Bought by
Moran Guadalupe
Current Estimated Value
Home Financials for this Owner
Home Financials are based on the most recent Mortgage that was taken out on this home.
Original Mortgage
$159,200
Interest Rate
6.52%
Purchase Details
Closed on
Oct 3, 1995
Sold by
Moran Diocelina
Bought by
Moran Rodolfo
Home Financials for this Owner
Home Financials are based on the most recent Mortgage that was taken out on this home.
Original Mortgage
$131,646
Interest Rate
7.59%
Mortgage Type
FHA
Purchase Details
Closed on
Sep 26, 1995
Sold by
Garcia Steve and Garcia Eva
Bought by
Moran Guadalupe
Home Financials for this Owner
Home Financials are based on the most recent Mortgage that was taken out on this home.
Original Mortgage
$131,646
Interest Rate
7.59%
Mortgage Type
FHA
Create a Home Valuation Report for This Property
The Home Valuation Report is an in-depth analysis detailing your home's value as well as a comparison with similar homes in the area
Home Values in the Area
Average Home Value in this Area
Purchase History
| Date | Buyer | Sale Price | Title Company |
|---|---|---|---|
| Moran Guadalupe | -- | Gateway Title | |
| Moran Rodolfo | -- | North American Title Co | |
| Moran Guadalupe | $134,500 | North American Title Co |
Source: Public Records
Mortgage History
| Date | Status | Borrower | Loan Amount |
|---|---|---|---|
| Previous Owner | Moran Guadalupe | $159,200 | |
| Previous Owner | Moran Guadalupe | $131,646 |
Source: Public Records
Tax History Compared to Growth
Tax History
| Year | Tax Paid | Tax Assessment Tax Assessment Total Assessment is a certain percentage of the fair market value that is determined by local assessors to be the total taxable value of land and additions on the property. | Land | Improvement |
|---|---|---|---|---|
| 2025 | $4,883 | $356,476 | $194,098 | $162,378 |
| 2024 | $4,883 | $349,488 | $190,293 | $159,195 |
| 2023 | $4,796 | $342,636 | $186,562 | $156,074 |
| 2022 | $4,671 | $335,918 | $182,904 | $153,014 |
| 2021 | $4,562 | $329,332 | $179,318 | $150,014 |
| 2019 | $4,672 | $319,565 | $174,000 | $145,565 |
| 2018 | $4,277 | $313,300 | $170,589 | $142,711 |
| 2016 | $3,836 | $301,136 | $163,966 | $137,170 |
| 2015 | $3,620 | $296,614 | $161,504 | $135,110 |
| 2014 | $3,711 | $290,805 | $158,341 | $132,464 |
Source: Public Records
Map
Nearby Homes
- 8746 Chester St
- 8709 Belmont St
- 15804 Lakewood Blvd
- 15605 Kervin Ave
- 9045 Algeroma St
- 16211 Downey Ave Unit 31
- 16412 Bixler Ave
- 16600 Downey Ave Unit 115
- 8808 Paseo St
- 9206 Rendalia St
- 15156 Bellota Ave
- 15154 Oliva Ave
- 16403 Parkshire Ct
- 9103 Maple St
- 9231 Laurel St
- 9118 Maple St
- 15121 Rancho Clemente Dr
- 8811 Park St Unit 122
- 8811 Park St Unit 85
- 9321 Harvard St