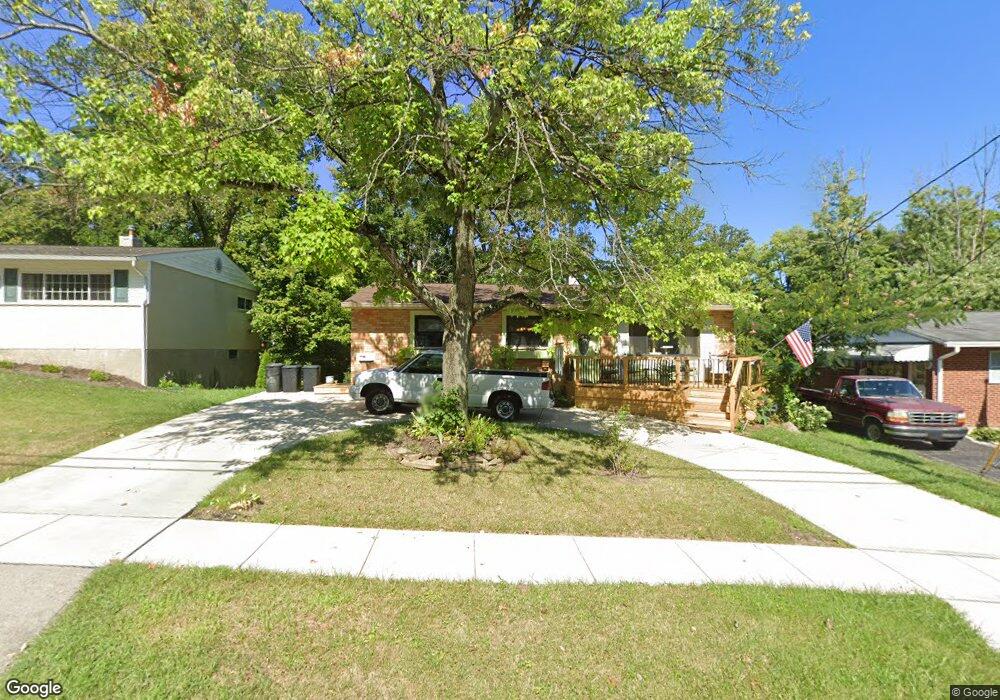
8721 Mockingbird Ln Cincinnati, OH 45231
Finneytown NeighborhoodEstimated Value: $162,000 - $237,000
3
Beds
1
Bath
1,420
Sq Ft
$146/Sq Ft
Est. Value
About This Home
This home is located at 8721 Mockingbird Ln, Cincinnati, OH 45231 and is currently estimated at $206,843, approximately $145 per square foot. 8721 Mockingbird Ln is a home located in Hamilton County with nearby schools including Finneytown Elementary School, Finneytown Secondary Campus, and St. Vivian School.
Ownership History
Date
Name
Owned For
Owner Type
Purchase Details
Closed on
Jun 19, 2009
Sold by
Us Bank National Association
Bought by
Bader Robert K and Bader Robert A
Current Estimated Value
Home Financials for this Owner
Home Financials are based on the most recent Mortgage that was taken out on this home.
Original Mortgage
$26,400
Interest Rate
5.49%
Mortgage Type
New Conventional
Purchase Details
Closed on
Apr 28, 2009
Sold by
Sturm Steven J
Bought by
Us Bank National Association and Sasco 2004-Wf4
Home Financials for this Owner
Home Financials are based on the most recent Mortgage that was taken out on this home.
Original Mortgage
$26,400
Interest Rate
5.49%
Mortgage Type
New Conventional
Purchase Details
Closed on
Apr 5, 2000
Sold by
Diane Sturm and Diane Steven J
Bought by
Sturm Steven J and Sturm Diane K
Create a Home Valuation Report for This Property
The Home Valuation Report is an in-depth analysis detailing your home's value as well as a comparison with similar homes in the area
Home Values in the Area
Average Home Value in this Area
Purchase History
| Date | Buyer | Sale Price | Title Company |
|---|---|---|---|
| Bader Robert K | $33,000 | None Available | |
| Us Bank National Association | $64,000 | None Available | |
| Sturm Steven J | -- | -- |
Source: Public Records
Mortgage History
| Date | Status | Borrower | Loan Amount |
|---|---|---|---|
| Previous Owner | Bader Robert K | $26,400 |
Source: Public Records
Tax History
| Year | Tax Paid | Tax Assessment Tax Assessment Total Assessment is a certain percentage of the fair market value that is determined by local assessors to be the total taxable value of land and additions on the property. | Land | Improvement |
|---|---|---|---|---|
| 2025 | $3,735 | $53,568 | $10,280 | $43,288 |
| 2024 | $3,649 | $53,568 | $10,280 | $43,288 |
| 2023 | $3,588 | $53,568 | $10,280 | $43,288 |
| 2022 | $3,323 | $35,994 | $10,143 | $25,851 |
| 2021 | $3,260 | $35,994 | $10,143 | $25,851 |
| 2020 | $3,313 | $35,994 | $10,143 | $25,851 |
| 2019 | $3,043 | $30,503 | $8,596 | $21,907 |
| 2018 | $2,809 | $30,503 | $8,596 | $21,907 |
| 2017 | $2,677 | $30,503 | $8,596 | $21,907 |
| 2016 | $985 | $10,977 | $8,880 | $2,097 |
| 2015 | $991 | $10,977 | $8,880 | $2,097 |
| 2014 | $992 | $10,977 | $8,880 | $2,097 |
| 2013 | $1,010 | $11,550 | $9,345 | $2,205 |
Source: Public Records
Map
Nearby Homes
- 8663 Mockingbird Ln
- 1116 Madeleine Cir
- 1052 Vacationland Dr
- 1125 Murkett Ct
- 8829 Mockingbird Ln
- 1144 Hempstead Dr
- 1101 Meadowind Ct
- 958 Hollytree Dr
- 8609 Balboa Dr
- 8433 Jonfred Ct
- 1123 Compton Rd
- 1285 Landis Ln
- 1115 Compton Rd
- 8990 Mockingbird Ln
- 7352 Clovernook Ave
- 1090 W Galbraith Rd
- 1202 Ashmore Ct
- 8491 Daly Rd
- 816 Sabino Ct
- 7227 Bernard Ave
- 8713 Mockingbird Ln
- 8729 Mockingbird Ln
- 8705 Mockingbird Ln
- 8737 Mockingbird Ln
- 8722 Mockingbird Ln
- 8710 Mockingbird Ln
- 8738 Mockingbird Ln
- 8699 Mockingbird Ln
- 8745 Mockingbird Ln
- 8686 Elmtree Ave
- 1046 Jonquil Ln
- 1140 Madeleine Cir
- 8692 Mockingbird Ln
- 1142 Madeleine Cir
- 8682 Elmtree Ave
- 8756 Mockingbird Ln
- 8687 Mockingbird Ln
- 1136 Madeleine Cir
- 1042 Jonquil Ln
- 1105 Tassie Ln
Your Personal Tour Guide
Ask me questions while you tour the home.