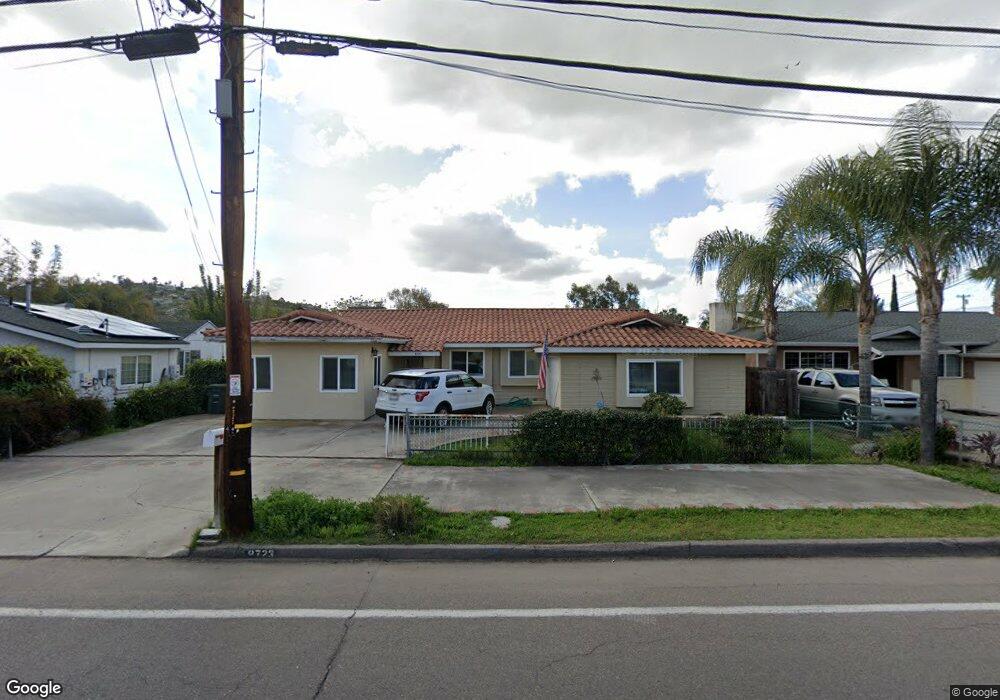
8723 Tyler St Spring Valley, CA 91977
Estimated Value: $560,000 - $793,000
4
Beds
2
Baths
2,135
Sq Ft
$325/Sq Ft
Est. Value
About This Home
This home is located at 8723 Tyler St, Spring Valley, CA 91977 and is currently estimated at $692,990, approximately $324 per square foot. 8723 Tyler St is a home located in San Diego County with nearby schools including Bancroft Elementary School, Science, Technology, Engineering, Arts, And Math Academy, and Mount Miguel High School.
Ownership History
Date
Name
Owned For
Owner Type
Purchase Details
Closed on
Nov 25, 2025
Sold by
Caldwell Jim
Bought by
New Fresh Investments Llc
Current Estimated Value
Purchase Details
Closed on
Apr 1, 1998
Sold by
Graham Edward C and Christie Julie R
Bought by
Caldwell Jim and Caldwell Caroln
Home Financials for this Owner
Home Financials are based on the most recent Mortgage that was taken out on this home.
Original Mortgage
$167,076
Interest Rate
7.07%
Mortgage Type
VA
Purchase Details
Closed on
Jan 25, 1996
Sold by
Graham Claire Hope
Bought by
Graham Edward Charles and Christie Julie Renee
Home Financials for this Owner
Home Financials are based on the most recent Mortgage that was taken out on this home.
Original Mortgage
$132,600
Interest Rate
6.98%
Mortgage Type
VA
Create a Home Valuation Report for This Property
The Home Valuation Report is an in-depth analysis detailing your home's value as well as a comparison with similar homes in the area
Home Values in the Area
Average Home Value in this Area
Purchase History
| Date | Buyer | Sale Price | Title Company |
|---|---|---|---|
| New Fresh Investments Llc | $552,000 | First American Title | |
| Caldwell Jim | $160,000 | Chicago Title Co | |
| Graham Edward Charles | $130,000 | First American Title |
Source: Public Records
Mortgage History
| Date | Status | Borrower | Loan Amount |
|---|---|---|---|
| Previous Owner | Caldwell Jim | $167,076 | |
| Previous Owner | Graham Edward Charles | $132,600 |
Source: Public Records
Tax History
| Year | Tax Paid | Tax Assessment Tax Assessment Total Assessment is a certain percentage of the fair market value that is determined by local assessors to be the total taxable value of land and additions on the property. | Land | Improvement |
|---|---|---|---|---|
| 2025 | $3,500 | $255,289 | $47,908 | $207,381 |
| 2024 | $3,500 | $250,284 | $46,969 | $203,315 |
| 2023 | $3,384 | $245,378 | $46,049 | $199,329 |
| 2022 | $3,320 | $240,568 | $45,147 | $195,421 |
| 2021 | $3,290 | $235,852 | $44,262 | $191,590 |
| 2020 | $3,153 | $233,435 | $43,809 | $189,626 |
| 2019 | $3,104 | $228,858 | $42,950 | $185,908 |
| 2018 | $2,999 | $224,371 | $42,108 | $182,263 |
| 2017 | $2,916 | $219,973 | $41,283 | $178,690 |
| 2016 | $2,802 | $215,661 | $40,474 | $175,187 |
| 2015 | $2,777 | $212,423 | $39,867 | $172,556 |
| 2014 | $2,728 | $208,263 | $39,087 | $169,176 |
Source: Public Records
Map
Nearby Homes
- 2515 Sweetwater Rd Unit SPC 23
- 2515 Sweetwater Rd Unit 63
- 2515 Sweetwater Rd Unit 32
- 2515 Sweetwater Rd Unit 72
- 2240 Kings View Cir
- 2551 Kings View Cir
- 2102 Kings View Cir
- 8941 Arlingdale Way
- 2014 Terraspiro Ave
- 2707 Sweetwater Rd
- 8409 Elkhorn St
- 1815 Sweetwater Rd Unit SPC 120
- 1815 Sweetwater Rd Unit 37
- 1815 Sweetwater Rd Unit SPC 121
- 1815 Sweetwater Rd Unit 155
- 8154 Golden Ave
- 8540 Vista Azul
- 8932 Troy St
- 8644 Eileen St
- 9126 Valencia St
- 8729 Tyler St
- 8711 Tyler St
- 8730 Tyler St
- 8718 Tyler St
- 8705 Tyler St
- 8714 Tyler St
- 8695 Tyler St
- 8735 Tyler St
- 2317 Kurley Ct
- 8746 Tyler St
- 8755 Tyler St
- 2251 Tyler Ct
- 2322 Kurley Ct
- 8685 Tyler St
- 2305 Spring Grove Ln
- 2335 Kurley Ct
- 8744 Tyler St
- 8762 Tyler St Unit A
- 8762 Tyler St
- 2311 Spring Grove Ln
Your Personal Tour Guide
Ask me questions while you tour the home.