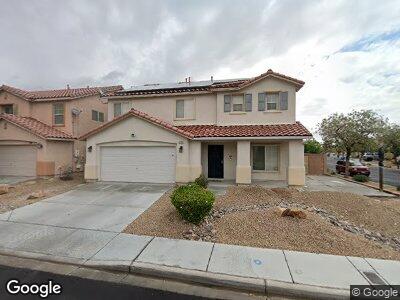
8724 Apiary Wind St Las Vegas, NV 89131
Tule Springs NeighborhoodEstimated Value: $516,974 - $574,000
4
Beds
3
Baths
2,791
Sq Ft
$192/Sq Ft
Est. Value
About This Home
This home is located at 8724 Apiary Wind St, Las Vegas, NV 89131 and is currently estimated at $535,744, approximately $191 per square foot. 8724 Apiary Wind St is a home located in Clark County with nearby schools including Kitty Mcdonough Ward Elementary School, Anthony Saville Middle School, and Shadow Ridge High School.
Ownership History
Date
Name
Owned For
Owner Type
Purchase Details
Closed on
Jan 20, 2010
Sold by
Lavine Matt
Bought by
Garduno Michael P and Garduno Kathlynn B
Current Estimated Value
Home Financials for this Owner
Home Financials are based on the most recent Mortgage that was taken out on this home.
Original Mortgage
$166,822
Outstanding Balance
$113,753
Interest Rate
5.25%
Mortgage Type
FHA
Estimated Equity
$427,804
Purchase Details
Closed on
Apr 27, 2005
Sold by
Kb Home Nevada Inc
Bought by
Lavine Matt
Home Financials for this Owner
Home Financials are based on the most recent Mortgage that was taken out on this home.
Original Mortgage
$301,550
Interest Rate
5.92%
Mortgage Type
Fannie Mae Freddie Mac
Create a Home Valuation Report for This Property
The Home Valuation Report is an in-depth analysis detailing your home's value as well as a comparison with similar homes in the area
Home Values in the Area
Average Home Value in this Area
Purchase History
| Date | Buyer | Sale Price | Title Company |
|---|---|---|---|
| Garduno Michael P | $169,900 | Fidelity National Title | |
| Lavine Matt | -- | Fidelity National Title | |
| Lavine Matt | $376,990 | First Amer Title Co Of Nv |
Source: Public Records
Mortgage History
| Date | Status | Borrower | Loan Amount |
|---|---|---|---|
| Open | Garduno Michael P | $12,145 | |
| Open | Garduno Michael P | $166,822 | |
| Previous Owner | Lavine Matt | $340,000 | |
| Previous Owner | Lavine Matt | $42,500 | |
| Previous Owner | Lavine Matt | $301,550 |
Source: Public Records
Tax History Compared to Growth
Tax History
| Year | Tax Paid | Tax Assessment Tax Assessment Total Assessment is a certain percentage of the fair market value that is determined by local assessors to be the total taxable value of land and additions on the property. | Land | Improvement |
|---|---|---|---|---|
| 2025 | $2,626 | $149,785 | $39,550 | $110,235 |
| 2024 | $2,550 | $149,785 | $39,550 | $110,235 |
| 2023 | $2,550 | $148,877 | $45,150 | $103,727 |
| 2022 | $2,714 | $128,993 | $34,300 | $94,693 |
| 2021 | $2,513 | $122,533 | $32,900 | $89,633 |
| 2020 | $2,331 | $113,547 | $32,900 | $80,647 |
| 2019 | $2,184 | $112,892 | $25,550 | $87,342 |
| 2018 | $2,084 | $97,996 | $21,350 | $76,646 |
| 2017 | $2,927 | $89,292 | $21,000 | $68,292 |
| 2016 | $1,951 | $80,367 | $15,750 | $64,617 |
| 2015 | $1,947 | $66,316 | $12,950 | $53,366 |
| 2014 | $1,886 | $57,190 | $10,500 | $46,690 |
Source: Public Records
Map
Nearby Homes
- 8723 Melissa Meadows St
- 5912 Kit Cove Ct
- 8811 Pauley Hills St
- 8828 Monte Oro Dr
- 5808 Amber Station Ave
- 5820 Amber Station Ave
- 5516 Coyote Falls Ct
- 5949 Casa Coronado Ave
- 8716 Purple Wisteria St
- 8840 Arroyo Azul St
- 8516 Canyon Ranch St
- 8953 Hitch Creek St
- 5713 Silver Cascade Ave
- 5916 Yellow Ridge Ave
- 5805 Cabo San Lucas Ave
- 5321 Welch Valley Ave
- 5905 Cabo San Lucas Ave
- 8566 Bright Bush St
- 9008 Sawhill Pond St
- 5213 Welch Valley Ave
- 8724 Apiary Wind St
- 8728 Apiary Wind St
- 8725 Cave Junction Ct
- 8729 Cave Junction Ct
- 8732 Apiary Wind St
- 8716 Apiary Wind St
- 8725 Apiary Wind St
- 8733 Cave Junction Ct
- 8729 Apiary Wind St Unit 2
- 8736 Apiary Wind St
- 5621 Raven Horse Dr
- 8733 Apiary Wind St
- 8717 Apiary Wind St
- 8737 Cave Junction Ct
- 8713 Apiary Wind St
- 8737 Apiary Wind St
- 5617 Raven Horse Dr
- 8728 Cave Junction Ct
- 8720 Melissa Meadows St
- 8740 Apiary Wind St