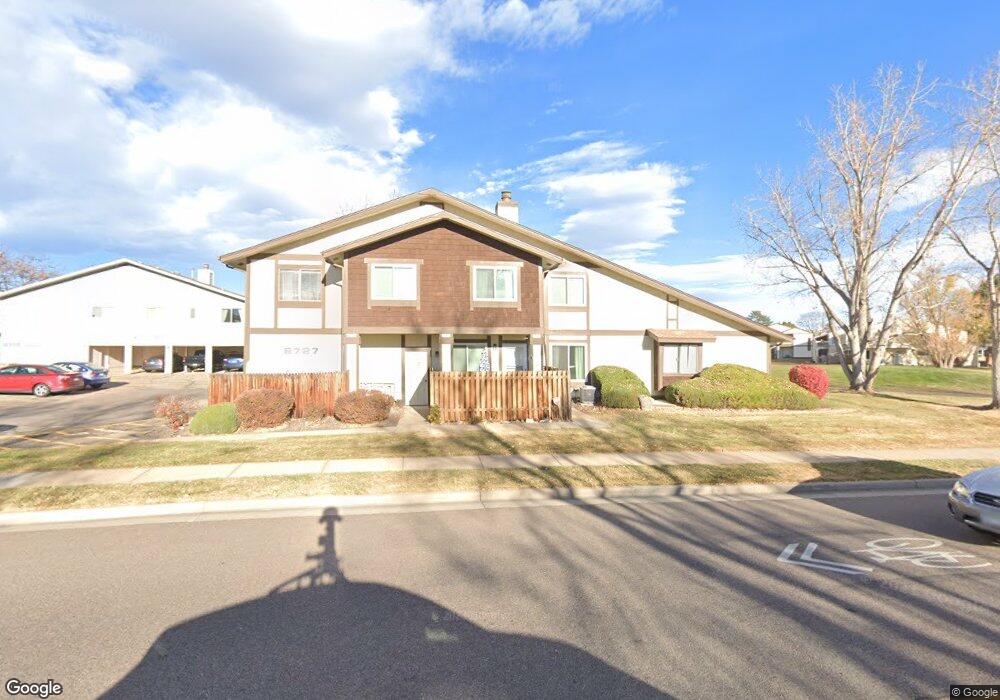
8727 Chase Dr Unit 229 Arvada, CO 80003
Lake Arbor NeighborhoodEstimated Value: $301,744 - $344,000
2
Beds
2
Baths
1,040
Sq Ft
$312/Sq Ft
Est. Value
About This Home
This home is located at 8727 Chase Dr Unit 229, Arvada, CO 80003 and is currently estimated at $324,436, approximately $311 per square foot. 8727 Chase Dr Unit 229 is a home located in Jefferson County with nearby schools including Little Elementary School, Pomona High School, and Woodrow Wilson Academy.
Ownership History
Date
Name
Owned For
Owner Type
Purchase Details
Closed on
Oct 3, 2002
Sold by
Suominen Charles
Bought by
Knutson Lisa E
Current Estimated Value
Home Financials for this Owner
Home Financials are based on the most recent Mortgage that was taken out on this home.
Original Mortgage
$94,250
Outstanding Balance
$47,125
Interest Rate
8.85%
Mortgage Type
Purchase Money Mortgage
Estimated Equity
$277,311
Purchase Details
Closed on
Aug 19, 2002
Sold by
Knutson Ann
Bought by
Knutson Lisa E
Home Financials for this Owner
Home Financials are based on the most recent Mortgage that was taken out on this home.
Original Mortgage
$94,250
Outstanding Balance
$47,125
Interest Rate
8.85%
Mortgage Type
Purchase Money Mortgage
Estimated Equity
$277,311
Purchase Details
Closed on
Apr 11, 2002
Sold by
Knutson Ann L
Bought by
Knutson Lisa E
Purchase Details
Closed on
Feb 15, 2002
Sold by
Knutson Gloria G
Bought by
Knutson Lisa E
Purchase Details
Closed on
Apr 5, 1995
Sold by
Kaffel Jacquelyn
Bought by
Haynes Larry
Create a Home Valuation Report for This Property
The Home Valuation Report is an in-depth analysis detailing your home's value as well as a comparison with similar homes in the area
Home Values in the Area
Average Home Value in this Area
Purchase History
| Date | Buyer | Sale Price | Title Company |
|---|---|---|---|
| Knutson Lisa E | -- | -- | |
| Knutson Lisa E | -- | -- | |
| Knutson Lisa E | -- | -- | |
| Knutson Lisa E | -- | -- | |
| Knutson Lisa E | $45,000 | -- | |
| Haynes Larry | -- | -- |
Source: Public Records
Mortgage History
| Date | Status | Borrower | Loan Amount |
|---|---|---|---|
| Open | Knutson Lisa E | $94,250 |
Source: Public Records
Tax History
| Year | Tax Paid | Tax Assessment Tax Assessment Total Assessment is a certain percentage of the fair market value that is determined by local assessors to be the total taxable value of land and additions on the property. | Land | Improvement |
|---|---|---|---|---|
| 2024 | $1,759 | $18,131 | $6,030 | $12,101 |
| 2023 | $1,759 | $18,131 | $6,030 | $12,101 |
| 2022 | $1,697 | $17,327 | $4,170 | $13,157 |
| 2021 | $1,725 | $17,825 | $4,290 | $13,535 |
| 2020 | $1,534 | $15,900 | $4,290 | $11,610 |
| 2019 | $1,514 | $15,900 | $4,290 | $11,610 |
| 2018 | $1,335 | $13,631 | $3,600 | $10,031 |
| 2017 | $1,222 | $13,631 | $3,600 | $10,031 |
| 2016 | $1,051 | $11,041 | $2,866 | $8,175 |
| 2015 | $812 | $11,041 | $2,866 | $8,175 |
| 2014 | $812 | $8,024 | $2,229 | $5,795 |
Source: Public Records
Map
Nearby Homes
- 6941 W 87th Way Unit 294
- 8762 Pierce Way Unit 121
- 8772 Chase Dr Unit 54
- 8781 Pierce Way Unit 102
- 6785 W 84th Way Unit 51
- 6855 W 84th Way Unit 32
- 6545 W 84th Way Unit 124
- 6545 W 84th Way Unit 127
- 8798 Chase Dr Unit 4
- 8397 Chase Dr
- 6620 W 84th Cir Unit 111
- 8414 Kendall Ct
- 6816 W 84th Cir Unit 38
- 6138 W 85th Place
- 8221 Marshall Ct
- 6400 W 83rd Place
- 8695 Yukon St Unit O
- 7862 W 84th Ct
- 7790 W 87th Dr Unit D
- 8685 Yukon St Unit 5
- 8727 Chase Dr Unit 230
- 8727 Chase Dr Unit 228
- 8727 Chase Dr Unit 227
- 8717 Chase Dr Unit 234
- 8717 Chase Dr Unit 233
- 8717 Chase Dr Unit 232
- 8717 Chase Dr Unit 231
- 8717 Chase Dr
- 8707 Chase Dr Unit 238
- 8707 Chase Dr Unit 237
- 8707 Chase Dr Unit 236
- 8707 Chase Dr Unit 235
- 8728 Chase Dr Unit 351
- 8728 Chase Dr Unit 350
- 8728 Chase Dr Unit 349
- 8718 Chase Dr Unit 348
- 8718 Chase Dr Unit 347
- 8718 Chase Dr Unit 346
- 8718 Chase Dr Unit 345
- 6922 W 87th Way Unit 242
Your Personal Tour Guide
Ask me questions while you tour the home.