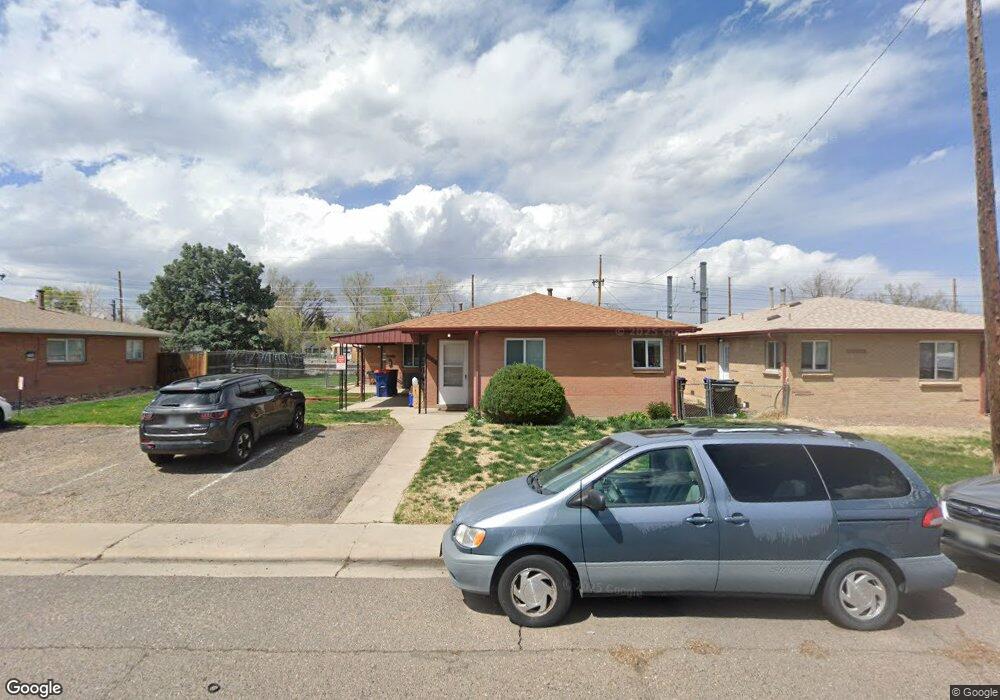
8727 W 54th Place Arvada, CO 80002
Estimated Value: $595,000 - $884,000
4
Beds
4
Baths
1,710
Sq Ft
$407/Sq Ft
Est. Value
About This Home
This home is located at 8727 W 54th Place, Arvada, CO 80002 and is currently estimated at $695,389, approximately $406 per square foot. 8727 W 54th Place is a home located in Jefferson County with nearby schools including Arvada K-8, Arvada High School, and Prospect Academy.
Ownership History
Date
Name
Owned For
Owner Type
Purchase Details
Closed on
Feb 8, 2001
Sold by
Behaeghe Alan M
Bought by
Sanders Mark and Sanders Annamari
Current Estimated Value
Home Financials for this Owner
Home Financials are based on the most recent Mortgage that was taken out on this home.
Original Mortgage
$164,000
Outstanding Balance
$58,219
Interest Rate
6.85%
Estimated Equity
$637,170
Purchase Details
Closed on
Jan 24, 2001
Sold by
Alan M Behaeghe Trust The
Bought by
Behaeghe Alan M
Home Financials for this Owner
Home Financials are based on the most recent Mortgage that was taken out on this home.
Original Mortgage
$164,000
Outstanding Balance
$58,219
Interest Rate
6.85%
Estimated Equity
$637,170
Purchase Details
Closed on
Oct 14, 1998
Sold by
Pham Ly N
Bought by
The Alan M Behaeghe Trust
Home Financials for this Owner
Home Financials are based on the most recent Mortgage that was taken out on this home.
Original Mortgage
$118,500
Interest Rate
6.81%
Create a Home Valuation Report for This Property
The Home Valuation Report is an in-depth analysis detailing your home's value as well as a comparison with similar homes in the area
Home Values in the Area
Average Home Value in this Area
Purchase History
| Date | Buyer | Sale Price | Title Company |
|---|---|---|---|
| Sanders Mark | $205,000 | -- | |
| Behaeghe Alan M | -- | -- | |
| The Alan M Behaeghe Trust | $158,000 | -- |
Source: Public Records
Mortgage History
| Date | Status | Borrower | Loan Amount |
|---|---|---|---|
| Open | Sanders Mark | $164,000 | |
| Previous Owner | The Alan M Behaeghe Trust | $118,500 |
Source: Public Records
Tax History Compared to Growth
Tax History
| Year | Tax Paid | Tax Assessment Tax Assessment Total Assessment is a certain percentage of the fair market value that is determined by local assessors to be the total taxable value of land and additions on the property. | Land | Improvement |
|---|---|---|---|---|
| 2024 | $3,784 | $39,007 | $11,889 | $27,118 |
| 2023 | $3,784 | $39,007 | $11,889 | $27,118 |
| 2022 | $2,851 | $29,115 | $8,608 | $20,507 |
| 2021 | $2,962 | $30,613 | $9,051 | $21,562 |
| 2020 | $2,974 | $30,814 | $7,833 | $22,981 |
| 2019 | $2,933 | $30,814 | $7,833 | $22,981 |
| 2018 | $2,188 | $22,349 | $5,347 | $17,002 |
| 2017 | $2,003 | $22,349 | $5,347 | $17,002 |
| 2016 | $1,785 | $18,544 | $5,012 | $13,532 |
| 2015 | $1,588 | $18,544 | $5,012 | $13,532 |
| 2014 | $1,588 | $15,684 | $4,628 | $11,056 |
Source: Public Records
Map
Nearby Homes
- 8623 W 54th Place
- 8735 W 54th Place
- 8520 W 55th Dr
- 5515 Dudley Ct
- 5402 Carr St Unit 102
- 5275 Cody St
- 5585 Cody Ct
- 5240 Dudley St
- 8251 W 54th Ave Unit 4
- 5600 Dover St
- 8237 W 54th Ave Unit 2
- 5630 Dover St
- 5210 Estes Cir
- 8408 W 52nd Ave
- 8977 W 56th Place
- 5396 Balsam St
- 5612 Carr St
- 8530 W 52nd Ave Unit A1
- 9100 Grandview Ave
- 5520 Garrison St
- 8731 W 54th Place
- 8726 W 54th Place
- 8619 W 54th Place
- 8736 W 54th Place
- 8716 W 54th Place
- 8626 W 54th Place
- 8739 W 54th Place
- 8615 W 54th Place
- 5410 Dudley Ct
- 8680 Clara Belle Dr
- 8640 Clara Belle Dr
- 5430 Estes St
- 5430 Dudley Ct
- 8620 Clara Belle Dr
- 8609 W 54th Place
- 5415 Dudley Ct
- 8600 Clara Belle Dr
- 5437 Dover St
- 5425 Dudley Ct
- 8605 W 54th Place