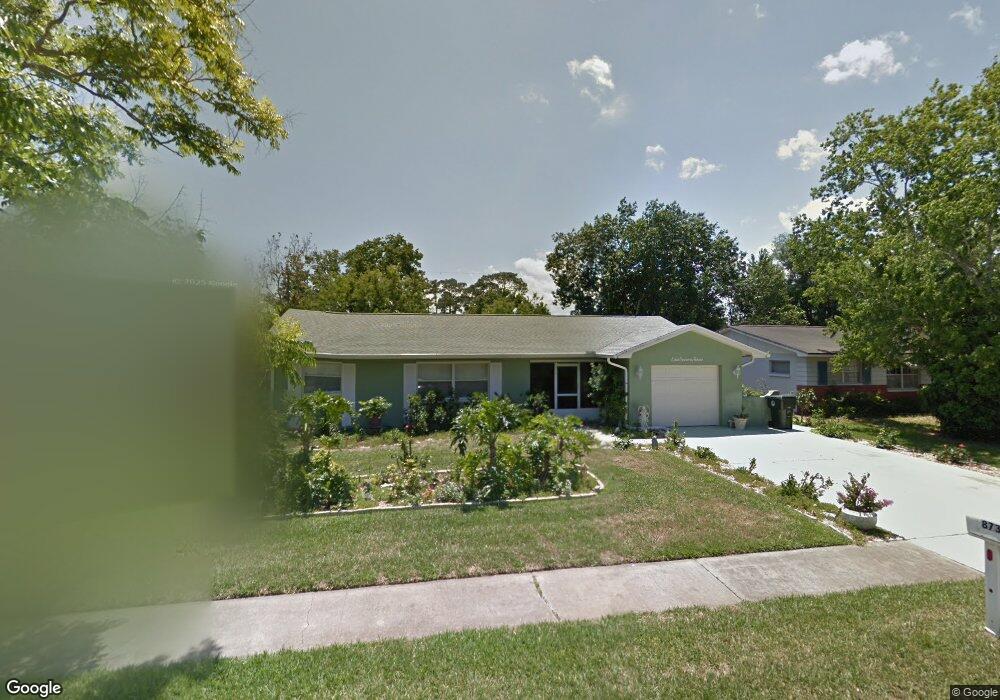
873 Kings Post Rd Rockledge, FL 32955
Estimated Value: $339,450 - $387,000
4
Beds
3
Baths
1,864
Sq Ft
$197/Sq Ft
Est. Value
About This Home
This home is located at 873 Kings Post Rd, Rockledge, FL 32955 and is currently estimated at $368,113, approximately $197 per square foot. 873 Kings Post Rd is a home located in Brevard County with nearby schools including Golfview Elementary School, John F. Kennedy Middle School, and Rockledge Senior High School.
Ownership History
Date
Name
Owned For
Owner Type
Purchase Details
Closed on
Jul 2, 2008
Sold by
Dixon Pamela M
Bought by
Dixon Pamela M and Pamela M Dixon Revocable Trust
Current Estimated Value
Purchase Details
Closed on
Jul 29, 2005
Sold by
Speigner Richard and Speigner Richanda
Bought by
Dixon Pamela M
Purchase Details
Closed on
Jun 28, 2000
Sold by
Adamson Mary F and Repass Mary Frances
Bought by
Speigner Richard C and Speigner Richanda L
Home Financials for this Owner
Home Financials are based on the most recent Mortgage that was taken out on this home.
Original Mortgage
$71,250
Interest Rate
8.63%
Purchase Details
Closed on
Oct 8, 1997
Sold by
Spyker William Donelson and Spyker Darlene W
Bought by
Adamson Mary F
Home Financials for this Owner
Home Financials are based on the most recent Mortgage that was taken out on this home.
Original Mortgage
$64,913
Interest Rate
7.6%
Create a Home Valuation Report for This Property
The Home Valuation Report is an in-depth analysis detailing your home's value as well as a comparison with similar homes in the area
Home Values in the Area
Average Home Value in this Area
Purchase History
| Date | Buyer | Sale Price | Title Company |
|---|---|---|---|
| Dixon Pamela M | -- | Attorney | |
| Dixon Pamela M | $214,300 | Security First Title Partner | |
| Speigner Richard C | $75,000 | -- | |
| Adamson Mary F | $65,000 | -- |
Source: Public Records
Mortgage History
| Date | Status | Borrower | Loan Amount |
|---|---|---|---|
| Previous Owner | Speigner Richard C | $71,250 | |
| Previous Owner | Adamson Mary F | $64,913 |
Source: Public Records
Tax History
| Year | Tax Paid | Tax Assessment Tax Assessment Total Assessment is a certain percentage of the fair market value that is determined by local assessors to be the total taxable value of land and additions on the property. | Land | Improvement |
|---|---|---|---|---|
| 2025 | $1,062 | $105,610 | -- | -- |
| 2024 | $1,034 | $102,640 | -- | -- |
| 2023 | $1,034 | $99,660 | $0 | $0 |
| 2022 | $948 | $96,760 | $0 | $0 |
| 2021 | $949 | $93,950 | $0 | $0 |
| 2020 | $943 | $92,660 | $0 | $0 |
| 2019 | $928 | $90,580 | $0 | $0 |
| 2018 | $922 | $88,900 | $0 | $0 |
| 2017 | $918 | $87,080 | $0 | $0 |
| 2016 | $917 | $85,290 | $27,500 | $57,790 |
| 2015 | $934 | $84,700 | $27,500 | $57,200 |
| 2014 | $929 | $84,030 | $23,000 | $61,030 |
Source: Public Records
Map
Nearby Homes
- 875 Kings Post Rd
- 900 Jamestown Dr
- 906 Beryl Dr
- 876 Brookview Ln
- 871 Southern Pine Trail
- 811 Topaz Dr
- 926 Jamestown Dr
- 864 Yorktowne Dr
- 874 Yellow Pine Ave
- 955 Bayberry Ln
- 834 Pine Shadows Ave
- 925 Pine Baugh St
- 864 Gardener Rd
- 821 Hanover Ct
- 972 Brewster Ln
- 964 Bucknell Place
- 813 Pine Shadows Ave
- 830 Saint Michel Dr
- 807 Poinciana St
- 881 Covington Ct
- 871 Kings Post Rd
- 874 Westport Dr
- 876 Westport Dr
- 872 Westport Dr
- 869 Kings Post Rd
- 877 Kings Post Rd
- 874 Kings Post Rd
- 872 Kings Post Rd Unit 5
- 872 Kings Post Rd
- 876 Kings Post Rd
- 878 Westport Dr
- 870 Westport Dr
- 870 Kings Post Rd
- 878 Kings Post Rd
- 867 Kings Post Rd
- 879 Kings Post Rd
- 868 Westport Dr
- 880 Westport Dr
- 889 Yorktowne Dr
- 873 Westport Dr
Your Personal Tour Guide
Ask me questions while you tour the home.