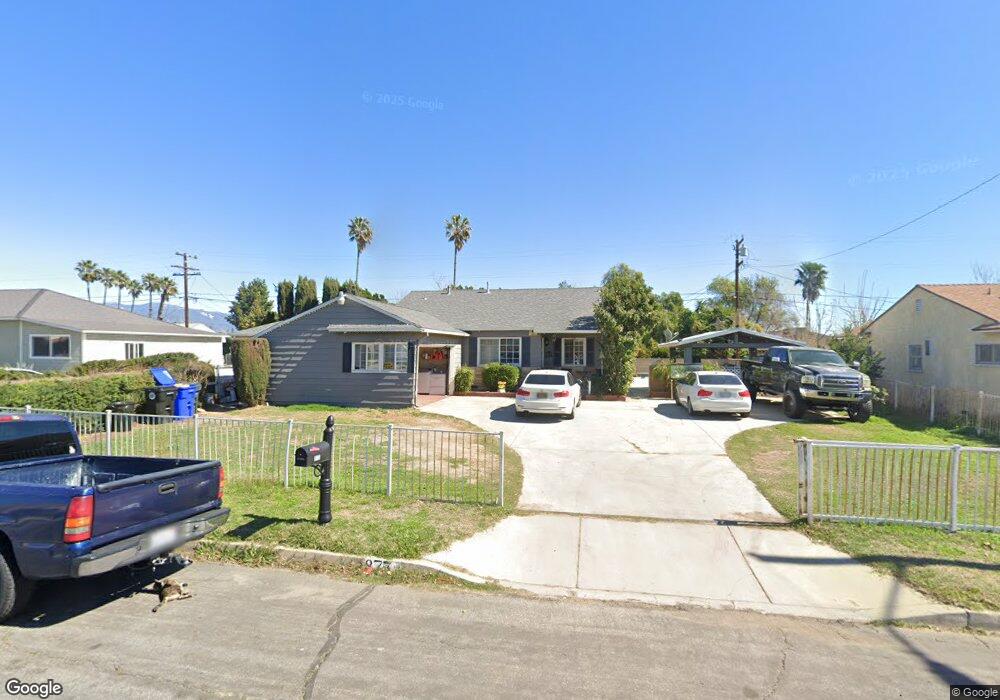
873 N Millard Ave Rialto, CA 92376
Estimated Value: $601,000 - $644,000
3
Beds
2
Baths
1,126
Sq Ft
$546/Sq Ft
Est. Value
About This Home
This home is located at 873 N Millard Ave, Rialto, CA 92376 and is currently estimated at $614,917, approximately $546 per square foot. 873 N Millard Ave is a home located in San Bernardino County with nearby schools including Dunn Elementary School, Ethel Kucera Middle School, and Eisenhower High School.
Ownership History
Date
Name
Owned For
Owner Type
Purchase Details
Closed on
Dec 24, 2020
Sold by
Duong David
Bought by
Duong David and Oo Doreen
Current Estimated Value
Home Financials for this Owner
Home Financials are based on the most recent Mortgage that was taken out on this home.
Original Mortgage
$311,250
Outstanding Balance
$277,599
Interest Rate
2.8%
Mortgage Type
New Conventional
Estimated Equity
$337,318
Purchase Details
Closed on
Sep 26, 2013
Sold by
Ta Richard Hung
Bought by
Duong David
Purchase Details
Closed on
Oct 26, 1998
Sold by
Rivera Diego F and Rivera Boo M
Bought by
Ocwen Federal Bank Fsb
Purchase Details
Closed on
Sep 21, 1998
Sold by
Ta Chanh Duong
Bought by
Ta Richard Hung
Purchase Details
Closed on
Jun 11, 1998
Sold by
Rivera Diego F and Rivera Boo M
Bought by
Ocwen Federal Bank Fsb
Create a Home Valuation Report for This Property
The Home Valuation Report is an in-depth analysis detailing your home's value as well as a comparison with similar homes in the area
Home Values in the Area
Average Home Value in this Area
Purchase History
| Date | Buyer | Sale Price | Title Company |
|---|---|---|---|
| Duong David | -- | Western Resources Title Co | |
| Duong David | -- | None Available | |
| Ocwen Federal Bank Fsb | $97,277 | First American Title Ins Co | |
| Ta Richard Hung | -- | First American Title Co | |
| Ta Richard Hung | $122,000 | First American Title Co | |
| Ocwen Federal Bank Fsb | $97,277 | Chicago Title Co |
Source: Public Records
Mortgage History
| Date | Status | Borrower | Loan Amount |
|---|---|---|---|
| Open | Duong David | $311,250 |
Source: Public Records
Tax History Compared to Growth
Tax History
| Year | Tax Paid | Tax Assessment Tax Assessment Total Assessment is a certain percentage of the fair market value that is determined by local assessors to be the total taxable value of land and additions on the property. | Land | Improvement |
|---|---|---|---|---|
| 2025 | $2,796 | $194,396 | $38,877 | $155,519 |
| 2024 | $2,796 | $190,585 | $38,115 | $152,470 |
| 2023 | $2,803 | $186,848 | $37,368 | $149,480 |
| 2022 | $2,733 | $183,184 | $36,635 | $146,549 |
| 2021 | $2,780 | $179,592 | $35,917 | $143,675 |
| 2020 | $2,780 | $177,751 | $35,549 | $142,202 |
| 2019 | $2,624 | $174,266 | $34,852 | $139,414 |
| 2018 | $2,566 | $170,849 | $34,169 | $136,680 |
| 2017 | $2,489 | $167,499 | $33,499 | $134,000 |
| 2016 | $2,201 | $164,215 | $32,842 | $131,373 |
| 2015 | $2,132 | $161,749 | $32,349 | $129,400 |
| 2014 | -- | $158,580 | $31,715 | $126,865 |
Source: Public Records
Map
Nearby Homes
- 885 N Millard Ave
- 836 N Millard Ave
- 215 W Valencia St
- 1018 N Millard Ave
- 1031 N Lilac Ave
- 590 N Lilac Ave
- 264 W Jackson St
- 242 W Jackson St
- 459 W Ramona Dr
- 624 N Yucca Ave
- 153 E Jackson St
- 955 W Jasmine Way
- 531 W Ramona Dr
- 991 N Magnolia Ave
- 847 N Idyllwild Ave
- 1032 N Sycamore Ave
- 350 N Clifford Ave
- 342 N Clifford Ave
- 649 W Ramona Dr
- 786 N Arrowhead Ave
- 873 N Millard Ave
- 861 N Millard Ave
- 885 N Millard Ave
- 860 N Clifford Ave
- 884 N Clifford Ave
- 849 N Millard Ave
- 872 N Millard Ave
- 897 N Millard Ave
- 860 N Millard Ave
- 884 N Millard Ave
- 896 N Clifford Ave
- 848 N Millard Ave
- 848 N Millard Ave
- 896 N Millard Ave
- 837 N Millard Ave
- 907 N Millard Ave
- 836 N Clifford Ave
- 873 N Clifford Ave
- 906 N Clifford Ave
- 839 N Vista Ave