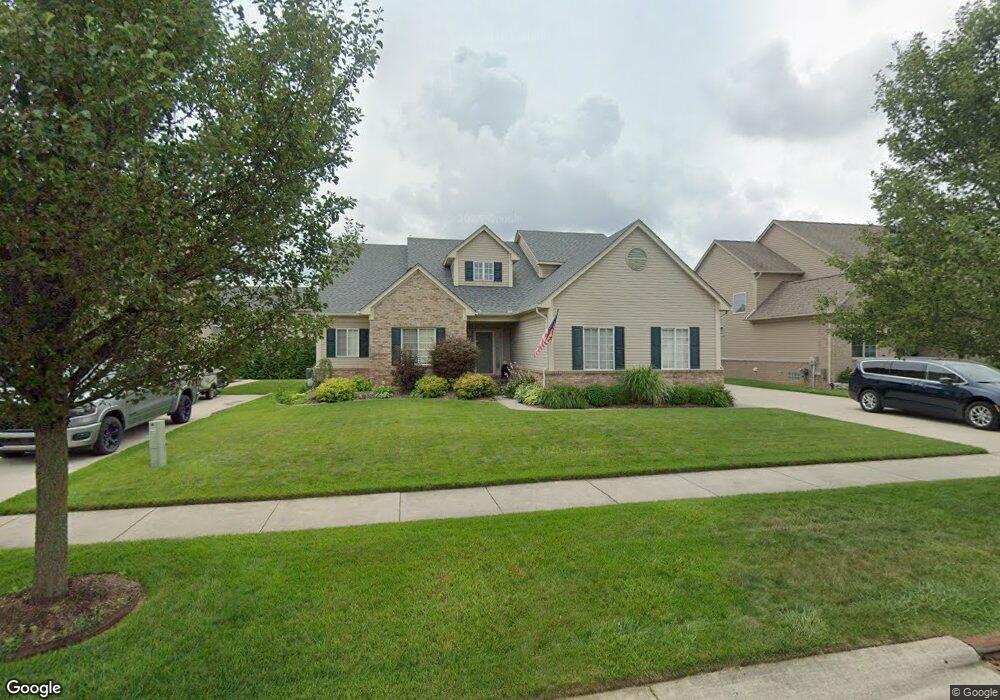
873 Pine Ridge Ave Oxford, MI 48371
Estimated Value: $508,000 - $611,000
3
Beds
3
Baths
2,646
Sq Ft
$207/Sq Ft
Est. Value
About This Home
This home is located at 873 Pine Ridge Ave, Oxford, MI 48371 and is currently estimated at $546,879, approximately $206 per square foot. 873 Pine Ridge Ave is a home located in Oakland County with nearby schools including Oxford Elementary School, Daniel Axford Elementary School, and Oxford Middle School.
Ownership History
Date
Name
Owned For
Owner Type
Purchase Details
Closed on
Nov 8, 2018
Sold by
Mester Chad Robert and Mester Cynthia Lynn
Bought by
Mester Chad Robert and Mester Cynthia Lynn
Current Estimated Value
Purchase Details
Closed on
Jul 12, 2005
Sold by
Cjm Development Inc
Bought by
West Cynthia L
Home Financials for this Owner
Home Financials are based on the most recent Mortgage that was taken out on this home.
Original Mortgage
$170,000
Outstanding Balance
$88,914
Interest Rate
5.69%
Mortgage Type
Fannie Mae Freddie Mac
Estimated Equity
$457,965
Purchase Details
Closed on
Jul 6, 2005
Sold by
Dimaria Homes & Associates Inc
Bought by
Cjm Development Inc
Home Financials for this Owner
Home Financials are based on the most recent Mortgage that was taken out on this home.
Original Mortgage
$170,000
Outstanding Balance
$88,914
Interest Rate
5.69%
Mortgage Type
Fannie Mae Freddie Mac
Estimated Equity
$457,965
Purchase Details
Closed on
Jan 13, 2005
Sold by
Westlake Of Waterstone Llc
Bought by
Dimaria Homes Inc
Create a Home Valuation Report for This Property
The Home Valuation Report is an in-depth analysis detailing your home's value as well as a comparison with similar homes in the area
Home Values in the Area
Average Home Value in this Area
Purchase History
| Date | Buyer | Sale Price | Title Company |
|---|---|---|---|
| Mester Chad Robert | -- | None Available | |
| West Cynthia L | $266,900 | Lawyers Title Insurance Co | |
| Cjm Development Inc | -- | -- | |
| Dimaria Homes Inc | $2,810,000 | Visionary Title Agency Llc |
Source: Public Records
Mortgage History
| Date | Status | Borrower | Loan Amount |
|---|---|---|---|
| Open | West Cynthia L | $170,000 | |
| Closed | West Cynthia L | $109,950 |
Source: Public Records
Tax History Compared to Growth
Tax History
| Year | Tax Paid | Tax Assessment Tax Assessment Total Assessment is a certain percentage of the fair market value that is determined by local assessors to be the total taxable value of land and additions on the property. | Land | Improvement |
|---|---|---|---|---|
| 2024 | $2,902 | $221,200 | $0 | $0 |
| 2023 | $2,768 | $194,630 | $0 | $0 |
| 2022 | $4,283 | $177,680 | $0 | $0 |
| 2021 | $4,095 | $166,910 | $0 | $0 |
| 2020 | $2,615 | $161,500 | $0 | $0 |
| 2019 | $3,822 | $154,890 | $0 | $0 |
| 2018 | $3,749 | $147,240 | $0 | $0 |
| 2017 | $3,602 | $142,840 | $0 | $0 |
| 2016 | $3,594 | $139,630 | $0 | $0 |
| 2015 | -- | $132,360 | $0 | $0 |
| 2014 | -- | $123,260 | $0 | $0 |
| 2011 | -- | $95,520 | $0 | $0 |
Source: Public Records
Map
Nearby Homes
- 822 Westlake Ave
- 720 Marlayna Dr
- 622 Westlake Ave
- 682 Westlake Ave
- 1151 Cross St Unit 21
- 496 Overlook Dr
- 372 Overlook Dr
- 1170 Glass Lake Cir
- 1531 Seymour Lake Rd
- 1465 Roy Rd
- 224 Stony Lake Dr Unit 57
- 1400 Ora Rd
- 778 W Peninsula Ct
- 861 Seymour Lake Rd
- 1858 Sandy Shores Dr
- 302 Tanview Dr
- 1904 Sandy Shores Dr
- 1974 Sandy Shores Dr
- 1611 Harwood Dr
- 600 Cornerstone Dr
- 865 Pineridge Ave
- 881 Pine Ridge Ave
- 870 W Bay Shore Dr
- 862 W Bayshore Dr
- 882 W Bayshore Dr
- 856 W Bayshore Dr
- 902 Chelsea Blvd
- 901 Woodside Dr
- 849 Pine Ridge Ave
- 848 W Bay Shore Dr
- 848 W Bay Shore Dr
- 870 Woodside Dr
- 848 W Bayshore Dr
- 911 Woodside Dr
- 880 Woodside Dr
- 912 Chelsea Blvd
- 890 Woodside Dr Unit Bldg-Unit
- 890 Woodside Dr
- 841 Pine Ridge Ave
- 860 Woodside Dr