8730 20th Ave NW Seattle, WA 98117
Crown Hill NeighborhoodEstimated Value: $1,111,415 - $1,293,000
3
Beds
2
Baths
2,160
Sq Ft
$555/Sq Ft
Est. Value
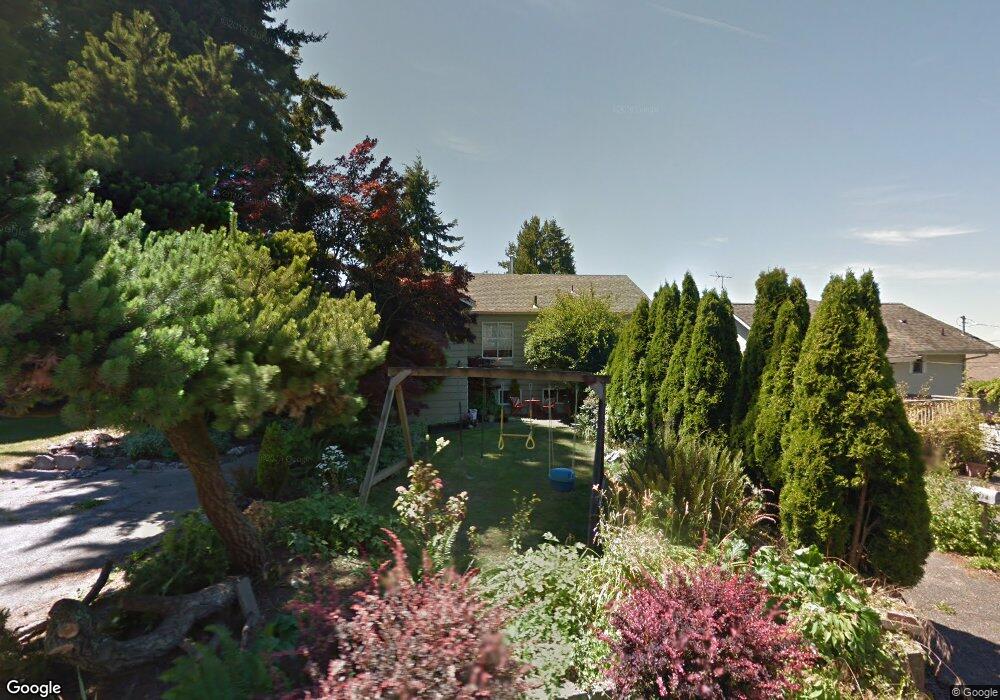
About This Home
This home is located at 8730 20th Ave NW, Seattle, WA 98117 and is currently estimated at $1,198,104, approximately $554 per square foot. 8730 20th Ave NW is a home located in King County with nearby schools including North Beach Elementary School, Whitman Middle School, and Ingraham High School.
Ownership History
Date
Name
Owned For
Owner Type
Purchase Details
Closed on
May 31, 2011
Sold by
Oaksmith Maurice and Oaksmith Gwendolyn E
Bought by
Fetters John and Mckibbin Megan
Current Estimated Value
Home Financials for this Owner
Home Financials are based on the most recent Mortgage that was taken out on this home.
Original Mortgage
$458,085
Outstanding Balance
$320,058
Interest Rate
4.92%
Mortgage Type
FHA
Estimated Equity
$878,046
Purchase Details
Closed on
May 24, 1999
Sold by
The Hagan Hofstad Trust
Bought by
Oaksmith Maurice and Oaksmith Gwendolyn E
Home Financials for this Owner
Home Financials are based on the most recent Mortgage that was taken out on this home.
Original Mortgage
$227,500
Interest Rate
6.86%
Purchase Details
Closed on
Nov 24, 1997
Sold by
Nordlund Gunvor
Bought by
Oaksmith Maurice and Tucker Gerald A
Home Financials for this Owner
Home Financials are based on the most recent Mortgage that was taken out on this home.
Original Mortgage
$182,800
Interest Rate
7.33%
Create a Home Valuation Report for This Property
The Home Valuation Report is an in-depth analysis detailing your home's value as well as a comparison with similar homes in the area
Home Values in the Area
Average Home Value in this Area
Purchase History
| Date | Buyer | Sale Price | Title Company |
|---|---|---|---|
| Fetters John | $470,000 | Commonwealth L | |
| Oaksmith Maurice | -- | Pacific Northwest Title | |
| Oaksmith Maurice | $228,500 | Chicago Title Ins Co |
Source: Public Records
Mortgage History
| Date | Status | Borrower | Loan Amount |
|---|---|---|---|
| Open | Fetters John | $458,085 | |
| Previous Owner | Oaksmith Maurice | $227,500 | |
| Previous Owner | Oaksmith Maurice | $182,800 |
Source: Public Records
Tax History Compared to Growth
Tax History
| Year | Tax Paid | Tax Assessment Tax Assessment Total Assessment is a certain percentage of the fair market value that is determined by local assessors to be the total taxable value of land and additions on the property. | Land | Improvement |
|---|---|---|---|---|
| 2024 | $9,472 | $927,000 | $697,000 | $230,000 |
| 2023 | $8,576 | $846,000 | $623,000 | $223,000 |
| 2022 | $8,426 | $972,000 | $559,000 | $413,000 |
| 2021 | $7,516 | $862,000 | $518,000 | $344,000 |
| 2020 | $7,543 | $724,000 | $441,000 | $283,000 |
| 2018 | $6,889 | $740,000 | $467,000 | $273,000 |
| 2017 | $6,216 | $656,000 | $414,000 | $242,000 |
| 2016 | $5,750 | $612,000 | $299,000 | $313,000 |
| 2015 | $5,001 | $553,000 | $271,000 | $282,000 |
| 2014 | -- | $490,000 | $241,000 | $249,000 |
| 2013 | -- | $452,000 | $223,000 | $229,000 |
Source: Public Records
Map
Nearby Homes
- 8739 17th Ave NW
- 8513 19th Ave NW Unit B
- 2119 NW 93rd St
- 1525 NW 90th St
- 9233 20th Ave NW
- 320 NW 85th St
- 2393 NW 90th St
- 8333 17th Ave NW
- 8356 16th Ave NW
- 9007 24th Ave NW
- 9044 15th Ave NW
- 9023 Mary Ave NW Unit 401
- 9045 Mary Ave NW Unit D
- 8324 16th Ave NW Unit E
- 8324 16th Ave NW Unit D
- 8324 16th Ave NW Unit B
- 8751 14th Ave NW Unit G
- 8040 19th Ave NW
- 8740 14th Ave NW
- 2521 NW 92nd St
- 8734 20th Ave NW
- 8724 20th Ave NW
- 8740 20th Ave NW
- 8716 20th Ave NW
- 8731 19th Ave NW
- 8742 20th Ave NW
- 8725 19th Ave NW
- 8735 19th Ave NW
- 8726 21st Ave NW
- 8720 21st Ave NW
- 8719 19th Ave NW
- 8732 21st Ave NW
- 8714 21st Ave NW
- 8708 20th Ave NW
- 8748 20th Ave NW
- 8715 19th Ave NW
- 8738 21st Ave NW
- 8708 21st Ave NW
- 8711 19th Ave NW