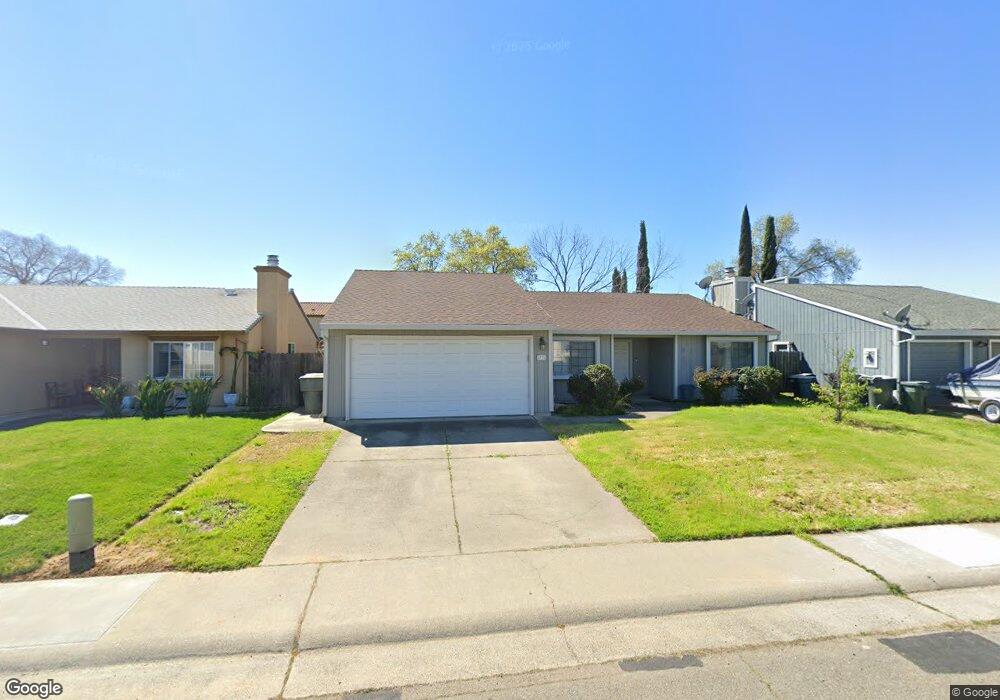
8736 Tiogawoods Dr Sacramento, CA 95828
Estimated Value: $196,000 - $459,000
3
Beds
2
Baths
1,342
Sq Ft
$292/Sq Ft
Est. Value
About This Home
This home is located at 8736 Tiogawoods Dr, Sacramento, CA 95828 and is currently estimated at $391,934, approximately $292 per square foot. 8736 Tiogawoods Dr is a home located in Sacramento County with nearby schools including Mary Tsukamoto Elementary School, T. R. Smedberg Middle School, and Sheldon High School.
Ownership History
Date
Name
Owned For
Owner Type
Purchase Details
Closed on
Jul 31, 2024
Sold by
Pham Natalie
Bought by
Natalie N Pham Family Trust and Pham
Current Estimated Value
Purchase Details
Closed on
Aug 10, 2022
Sold by
Minh Nguyen
Bought by
Pham Natalie
Purchase Details
Closed on
Sep 10, 2021
Sold by
Tdn Management
Bought by
Pham Natalie and Nguyen Minh
Purchase Details
Closed on
Jan 1, 2015
Sold by
Nguyen Minh and Pham Natalie
Bought by
Tdn Management
Purchase Details
Closed on
Dec 2, 2008
Sold by
Us Bank National Association
Bought by
Nguyen Minh and Pham Natalie Y
Home Financials for this Owner
Home Financials are based on the most recent Mortgage that was taken out on this home.
Original Mortgage
$70,875
Interest Rate
6.03%
Mortgage Type
Purchase Money Mortgage
Purchase Details
Closed on
Sep 25, 2008
Sold by
Cheatom Maria and Cheatom Mark
Bought by
Us Bank Na
Purchase Details
Closed on
Sep 7, 2005
Sold by
Cheatom Maria
Bought by
Cheatom Mark and Cheatom Maria
Home Financials for this Owner
Home Financials are based on the most recent Mortgage that was taken out on this home.
Original Mortgage
$292,000
Interest Rate
6.27%
Mortgage Type
Purchase Money Mortgage
Purchase Details
Closed on
Dec 16, 2004
Sold by
Cheatom Mark
Bought by
Cheatom Maria
Home Financials for this Owner
Home Financials are based on the most recent Mortgage that was taken out on this home.
Original Mortgage
$236,800
Interest Rate
4.62%
Mortgage Type
New Conventional
Purchase Details
Closed on
Oct 31, 2002
Sold by
Sullivan Anna Charlotte Gudrun F and Gudrun F Sullivan Trust
Bought by
Schwander James M and Schwander Nicole
Home Financials for this Owner
Home Financials are based on the most recent Mortgage that was taken out on this home.
Original Mortgage
$180,450
Interest Rate
6.06%
Mortgage Type
FHA
Purchase Details
Closed on
Feb 1, 2002
Sold by
Sullivan Gudrun
Bought by
Sullivan Anna Charlotte Gudrun F and Gudrun F Sullivan Trust
Home Financials for this Owner
Home Financials are based on the most recent Mortgage that was taken out on this home.
Original Mortgage
$128,000
Interest Rate
7.15%
Purchase Details
Closed on
May 2, 2000
Sold by
Sullivan Gudrun
Bought by
Sullivan Anna Charlotte Gudrun F and The Sullivan Trust
Create a Home Valuation Report for This Property
The Home Valuation Report is an in-depth analysis detailing your home's value as well as a comparison with similar homes in the area
Home Values in the Area
Average Home Value in this Area
Purchase History
| Date | Buyer | Sale Price | Title Company |
|---|---|---|---|
| Natalie N Pham Family Trust | -- | None Listed On Document | |
| Natalie N Pham Family Trust | -- | None Listed On Document | |
| Pham Natalie | -- | None Listed On Document | |
| Pham Natalie | -- | None Available | |
| Pham Natalie | -- | None Available | |
| Tdn Management | -- | None Available | |
| Nguyen Minh | $94,500 | Orange Coast Title Lender Se | |
| Us Bank Na | $87,685 | Accommodation | |
| Cheatom Mark | -- | Alliance Title Company | |
| Cheatom Maria | -- | Alliance Title Company | |
| Cheatom Maria | $296,000 | Alliance Title Company | |
| Schwander James M | $183,000 | North American Title Company | |
| Sullivan Anna Charlotte Gudrun F | -- | North American Title Co | |
| Sullivan Gudrun | -- | North American Title Co | |
| Sullivan Anna Charlotte Gudrun F | -- | -- |
Source: Public Records
Mortgage History
| Date | Status | Borrower | Loan Amount |
|---|---|---|---|
| Previous Owner | Nguyen Minh | $70,875 | |
| Previous Owner | Cheatom Mark | $292,000 | |
| Previous Owner | Cheatom Maria | $236,800 | |
| Previous Owner | Schwander James M | $180,450 | |
| Previous Owner | Sullivan Gudrun | $128,000 | |
| Closed | Schwander James M | $10,000 | |
| Closed | Cheatom Maria | $59,200 |
Source: Public Records
Tax History Compared to Growth
Tax History
| Year | Tax Paid | Tax Assessment Tax Assessment Total Assessment is a certain percentage of the fair market value that is determined by local assessors to be the total taxable value of land and additions on the property. | Land | Improvement |
|---|---|---|---|---|
| 2025 | $1,350 | $121,676 | $64,379 | $57,297 |
| 2024 | $1,350 | $119,291 | $63,117 | $56,174 |
| 2023 | $1,317 | $116,953 | $61,880 | $55,073 |
| 2022 | $1,295 | $114,661 | $60,667 | $53,994 |
| 2021 | $1,281 | $112,414 | $59,478 | $52,936 |
| 2020 | $1,264 | $111,263 | $58,869 | $52,394 |
| 2019 | $1,242 | $109,082 | $57,715 | $51,367 |
| 2018 | $1,209 | $106,944 | $56,584 | $50,360 |
| 2017 | $1,189 | $104,848 | $55,475 | $49,373 |
| 2016 | $1,130 | $102,793 | $54,388 | $48,405 |
| 2015 | $1,109 | $101,250 | $53,572 | $47,678 |
| 2014 | $1,092 | $99,268 | $52,523 | $46,745 |
Source: Public Records
Map
Nearby Homes
- 8695 Esperia Way
- 8733 Nakota Way
- 8800 Tiogawoods Dr
- 7790 Finnhorse Way
- 8798 Caselman Rd
- 0 Lakewood Rd
- 8837 Navarrin Way
- 8617 Oldwoods Way
- 8609 Tiogawoods Dr
- 7637 Eastbreeze Cir
- 7604 Eastbreeze Cir
- 7753 Southland Way
- 8901 Leland Ave
- 7714 Southland Way
- 7711 Lakewood Park Dr
- 8932 Caselman Rd
- 7855 Cottonwood Ln Unit 118
- 7855 Cottonwood Ln Unit 54
- 7855 Cottonwood Ln Unit 35
- 8762 Lemas Rd
- 8740 Tiogawoods Dr
- 8732 Tiogawoods Dr
- 8728 Tiogawoods Dr
- 8744 Tiogawoods Dr
- 8737 Tiogawoods Dr
- 8747 Esperia Way
- 8743 Esperia Way
- 8733 Tiogawoods Dr
- 8741 Tiogawoods Dr
- 8751 Esperia Way
- 8724 Tiogawoods Dr
- 8748 Tiogawoods Dr
- 8739 Exbourne Cir
- 8739 Esperia Way
- 8729 Tiogawoods Dr
- 7792 Southbreeze Dr
- 8735 Exbourne Cir
- 8735 Esperia Way
- 8725 Tiogawoods Dr
- 8720 Tiogawoods Dr