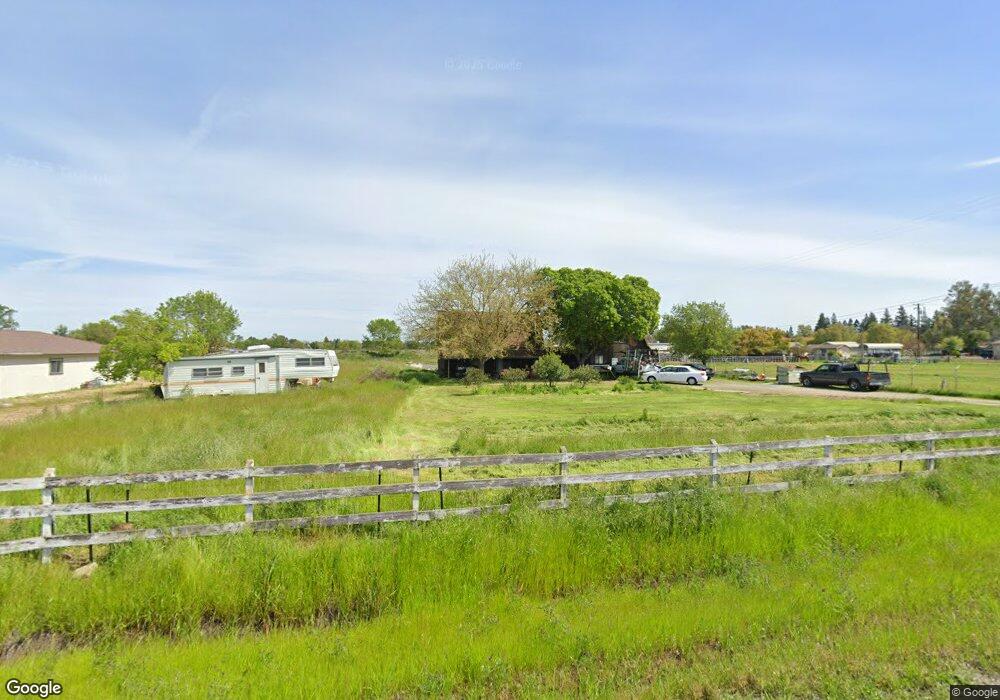
8737 Bader Rd Elk Grove, CA 95624
North East Elk Grove NeighborhoodEstimated Value: $553,000 - $1,165,000
3
Beds
2
Baths
1,328
Sq Ft
$643/Sq Ft
Est. Value
About This Home
This home is located at 8737 Bader Rd, Elk Grove, CA 95624 and is currently estimated at $853,607, approximately $642 per square foot. 8737 Bader Rd is a home located in Sacramento County with nearby schools including Pleasant Grove Elementary School, Katherine L. Albiani Middle School, and Pleasant Grove High School.
Ownership History
Date
Name
Owned For
Owner Type
Purchase Details
Closed on
Aug 11, 2005
Sold by
Robles Rito M
Bought by
Robles Rito
Current Estimated Value
Home Financials for this Owner
Home Financials are based on the most recent Mortgage that was taken out on this home.
Original Mortgage
$284,000
Interest Rate
6.25%
Mortgage Type
Unknown
Purchase Details
Closed on
Mar 26, 2004
Sold by
Robles Rito M
Bought by
Robles Rito M
Home Financials for this Owner
Home Financials are based on the most recent Mortgage that was taken out on this home.
Original Mortgage
$160,000
Interest Rate
8%
Mortgage Type
Stand Alone Refi Refinance Of Original Loan
Purchase Details
Closed on
May 27, 2003
Sold by
Robles Rito M
Bought by
Robles Rito M
Purchase Details
Closed on
Mar 18, 2003
Sold by
Robles Peggy A
Bought by
Robles Rito M
Purchase Details
Closed on
Oct 3, 1995
Sold by
Robles Rito M and Robles Peggy A
Bought by
Robles Rito M and Robles Peggy A
Create a Home Valuation Report for This Property
The Home Valuation Report is an in-depth analysis detailing your home's value as well as a comparison with similar homes in the area
Home Values in the Area
Average Home Value in this Area
Purchase History
| Date | Buyer | Sale Price | Title Company |
|---|---|---|---|
| Robles Rito | -- | First American Title Co | |
| Robles Rito M | -- | First American Title Co | |
| Robles Rito M | -- | -- | |
| Robles Rito M | -- | -- | |
| Robles Rito M | -- | -- |
Source: Public Records
Mortgage History
| Date | Status | Borrower | Loan Amount |
|---|---|---|---|
| Closed | Robles Rito | $284,000 | |
| Closed | Robles Rito M | $160,000 |
Source: Public Records
Tax History Compared to Growth
Tax History
| Year | Tax Paid | Tax Assessment Tax Assessment Total Assessment is a certain percentage of the fair market value that is determined by local assessors to be the total taxable value of land and additions on the property. | Land | Improvement |
|---|---|---|---|---|
| 2025 | $1,782 | $134,346 | $16,463 | $117,883 |
| 2024 | $1,782 | $131,713 | $16,141 | $115,572 |
| 2023 | $1,754 | $129,131 | $15,825 | $113,306 |
| 2022 | $1,704 | $126,600 | $15,515 | $111,085 |
| 2021 | $1,678 | $124,118 | $15,211 | $108,907 |
| 2020 | $1,715 | $122,847 | $15,056 | $107,791 |
| 2019 | $1,788 | $120,439 | $14,761 | $105,678 |
| 2018 | $1,309 | $118,078 | $14,472 | $103,606 |
| 2017 | $1,362 | $115,764 | $14,189 | $101,575 |
| 2016 | $1,302 | $113,495 | $13,911 | $99,584 |
| 2015 | $1,363 | $111,792 | $13,703 | $98,089 |
| 2014 | $1,177 | $109,605 | $13,437 | $96,168 |
Source: Public Records
Map
Nearby Homes
- 8651 Bader Rd
- 8688 Cherrington Ln
- 8696 Cherrington Ln
- 8595 Mackey Rd
- 8580 Bradshaw Rd
- 10174 Atlantis Dr
- 10150 Pleasant Grove School Rd
- 8312 Cabochon Way
- 0 Bradshaw Rd Unit 225026412
- 8730 Dasani Way
- 10077 Cristo Dr
- 10370 Pleasant Grove School Rd
- 10042 Silver Meadow Way
- 9225 Majesties Ct
- 8600 Excelsior Rd
- 9567 Moon River Way
- 9980 Crystal Creek Dr
- 9633 Respect Dr
- 8294 Courage Dr
- 9492 Del Seis Dr