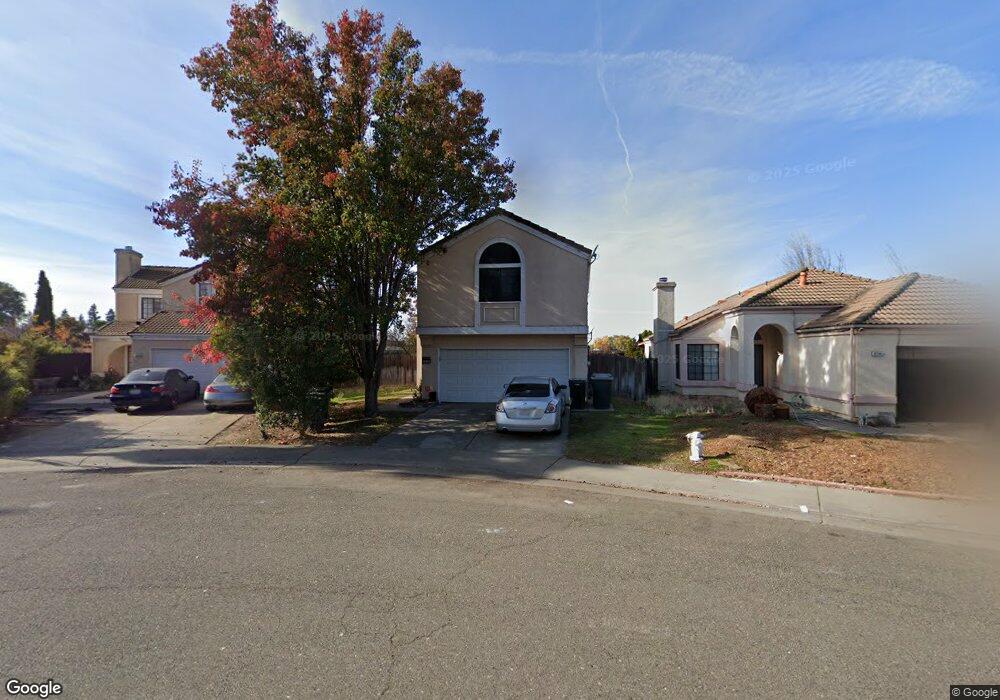
8738 Lemas Rd Sacramento, CA 95828
Estimated Value: $441,000 - $494,000
3
Beds
3
Baths
1,457
Sq Ft
$326/Sq Ft
Est. Value
About This Home
This home is located at 8738 Lemas Rd, Sacramento, CA 95828 and is currently estimated at $474,860, approximately $325 per square foot. 8738 Lemas Rd is a home located in Sacramento County with nearby schools including Mary Tsukamoto Elementary School, T. R. Smedberg Middle School, and Sheldon High School.
Ownership History
Date
Name
Owned For
Owner Type
Purchase Details
Closed on
Apr 2, 2007
Sold by
Fremont Investment & Loan
Bought by
Merritt Paul R and Merritt Kari L
Current Estimated Value
Home Financials for this Owner
Home Financials are based on the most recent Mortgage that was taken out on this home.
Original Mortgage
$233,920
Outstanding Balance
$141,045
Interest Rate
6.1%
Mortgage Type
Purchase Money Mortgage
Estimated Equity
$333,815
Purchase Details
Closed on
Nov 10, 2006
Sold by
Noyogiere Osa and Noyogiere Andilaw
Bought by
Fremont Investment & Loan
Purchase Details
Closed on
Oct 17, 2005
Sold by
Dickson Richard D and Dickson Michelle R
Bought by
Noyogiere Osa and Noyogiere Andilaw
Home Financials for this Owner
Home Financials are based on the most recent Mortgage that was taken out on this home.
Original Mortgage
$73,800
Interest Rate
5.67%
Mortgage Type
Fannie Mae Freddie Mac
Create a Home Valuation Report for This Property
The Home Valuation Report is an in-depth analysis detailing your home's value as well as a comparison with similar homes in the area
Home Values in the Area
Average Home Value in this Area
Purchase History
| Date | Buyer | Sale Price | Title Company |
|---|---|---|---|
| Merritt Paul R | $292,500 | Financial Title Company | |
| Fremont Investment & Loan | $314,404 | None Available | |
| Noyogiere Osa | $369,000 | First American Title Co |
Source: Public Records
Mortgage History
| Date | Status | Borrower | Loan Amount |
|---|---|---|---|
| Open | Merritt Paul R | $233,920 | |
| Previous Owner | Noyogiere Osa | $73,800 |
Source: Public Records
Tax History Compared to Growth
Tax History
| Year | Tax Paid | Tax Assessment Tax Assessment Total Assessment is a certain percentage of the fair market value that is determined by local assessors to be the total taxable value of land and additions on the property. | Land | Improvement |
|---|---|---|---|---|
| 2025 | $4,326 | $391,733 | $133,968 | $257,765 |
| 2024 | $4,326 | $384,053 | $131,342 | $252,711 |
| 2023 | $4,219 | $376,523 | $128,767 | $247,756 |
| 2022 | $4,148 | $369,142 | $126,243 | $242,899 |
| 2021 | $3,815 | $334,761 | $114,484 | $220,277 |
| 2020 | $3,340 | $291,098 | $99,552 | $191,546 |
| 2019 | $3,195 | $277,237 | $94,812 | $182,425 |
| 2018 | $3,031 | $264,037 | $90,298 | $173,739 |
| 2017 | $2,829 | $244,480 | $83,610 | $160,870 |
| 2016 | $2,456 | $216,355 | $73,992 | $142,363 |
| 2015 | $2,246 | $196,687 | $67,266 | $129,421 |
| 2014 | $2,087 | $180,447 | $61,712 | $118,735 |
Source: Public Records
Map
Nearby Homes
- 8005 Delage Way
- 8034 Kelty Ct
- 8716 Cord Way
- 8798 Caselman Rd
- 8880 Sonoma Valley Way
- 8916 Hollowstone Way
- 8733 Nakota Way
- 8247 Derbyshire Cir
- 8170 Derbyshire Cir
- 7790 Finnhorse Way
- 8837 Navarrin Way
- 7926 Asiatic Lion Ct
- 8800 Tiogawoods Dr
- 8695 Esperia Way
- 8932 Caselman Rd
- 8977 Carlisle Ave
- 8159 Morgan Hill Way
- 8510 Cavendish Way
- 8901 Leland Ave
- 8609 Tiogawoods Dr