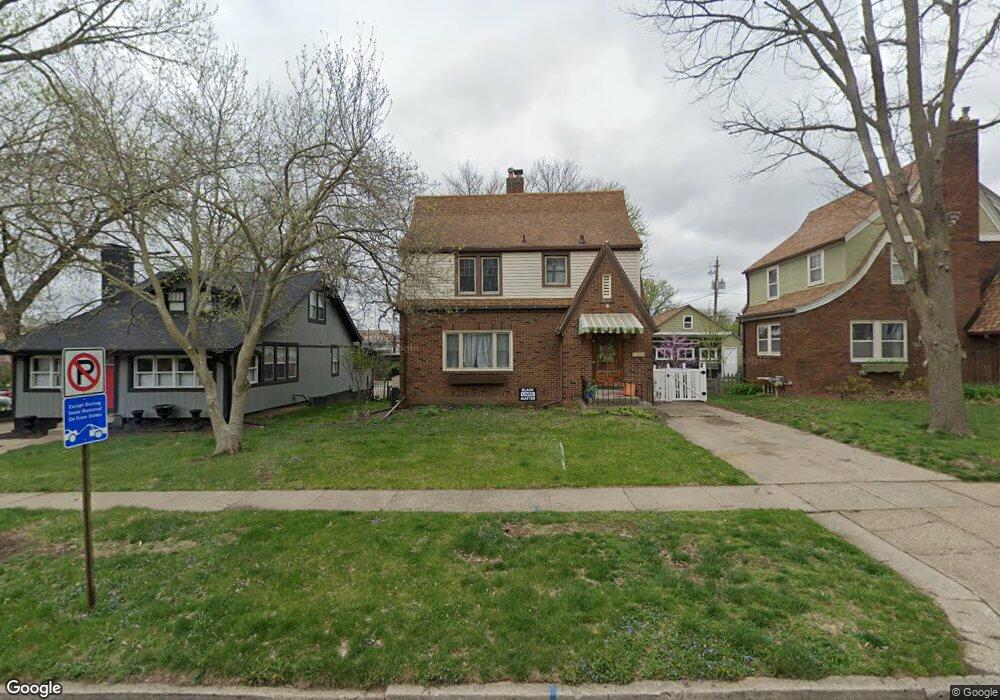
874 41st St Des Moines, IA 50312
Drake NeighborhoodEstimated Value: $266,000 - $293,000
3
Beds
1
Bath
1,704
Sq Ft
$164/Sq Ft
Est. Value
About This Home
This home is located at 874 41st St, Des Moines, IA 50312 and is currently estimated at $279,806, approximately $164 per square foot. 874 41st St is a home located in Polk County with nearby schools including Hubbell Elementary, Roosevelt High School, and Bergman Academy.
Ownership History
Date
Name
Owned For
Owner Type
Purchase Details
Closed on
May 11, 2021
Sold by
Wrigley Sharon and Harris Jack L
Bought by
Cam 2021 Llc
Current Estimated Value
Home Financials for this Owner
Home Financials are based on the most recent Mortgage that was taken out on this home.
Original Mortgage
$264,423
Outstanding Balance
$239,123
Interest Rate
3.1%
Mortgage Type
Construction
Estimated Equity
$40,683
Purchase Details
Closed on
Apr 21, 2007
Sold by
Harris Jack L and Harris Beverly M
Bought by
Harris Jack L and Harris Beverly M
Purchase Details
Closed on
Nov 22, 2004
Sold by
Lemon Marjorie A
Bought by
Harris Jack L and Harris Beverly M
Create a Home Valuation Report for This Property
The Home Valuation Report is an in-depth analysis detailing your home's value as well as a comparison with similar homes in the area
Home Values in the Area
Average Home Value in this Area
Purchase History
| Date | Buyer | Sale Price | Title Company |
|---|---|---|---|
| Cam 2021 Llc | $155,000 | None Available | |
| Harris Jack L | -- | None Available | |
| Harris Jack L | -- | -- |
Source: Public Records
Mortgage History
| Date | Status | Borrower | Loan Amount |
|---|---|---|---|
| Open | Cam 2021 Llc | $264,423 |
Source: Public Records
Tax History Compared to Growth
Tax History
| Year | Tax Paid | Tax Assessment Tax Assessment Total Assessment is a certain percentage of the fair market value that is determined by local assessors to be the total taxable value of land and additions on the property. | Land | Improvement |
|---|---|---|---|---|
| 2025 | $5,190 | $289,900 | $46,900 | $243,000 |
| 2024 | $5,190 | $263,800 | $42,400 | $221,400 |
| 2023 | $5,242 | $263,800 | $42,400 | $221,400 |
| 2022 | $5,202 | $222,400 | $37,300 | $185,100 |
| 2021 | $4,728 | $222,400 | $37,300 | $185,100 |
| 2020 | $4,908 | $198,100 | $33,600 | $164,500 |
| 2019 | $4,460 | $198,100 | $33,600 | $164,500 |
| 2018 | $4,410 | $174,500 | $29,200 | $145,300 |
| 2017 | $4,064 | $174,500 | $29,200 | $145,300 |
| 2016 | $3,954 | $158,800 | $26,600 | $132,200 |
| 2015 | $3,954 | $158,800 | $26,600 | $132,200 |
| 2014 | $3,832 | $152,900 | $25,100 | $127,800 |
Source: Public Records
Map
Nearby Homes