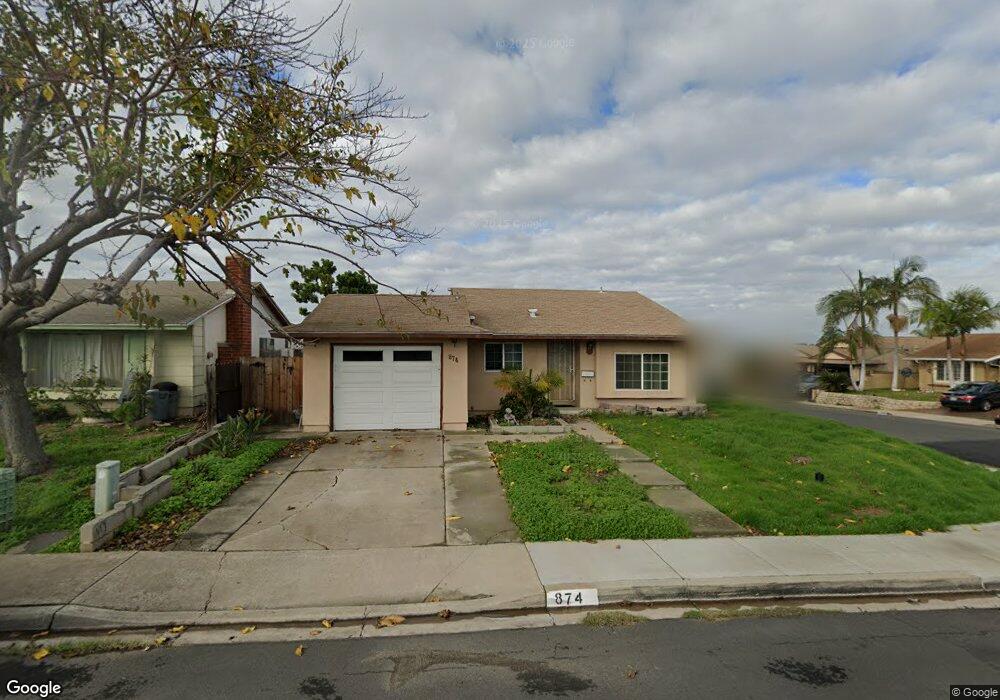
874 Joshua Place San Diego, CA 92154
Otay Mesa West NeighborhoodEstimated Value: $697,751 - $777,000
2
Beds
1
Bath
1,174
Sq Ft
$639/Sq Ft
Est. Value
About This Home
This home is located at 874 Joshua Place, San Diego, CA 92154 and is currently estimated at $750,688, approximately $639 per square foot. 874 Joshua Place is a home located in San Diego County with nearby schools including Juarez Lincoln Elementary School, Montgomery Middle School, and Montgomery Senior High School.
Ownership History
Date
Name
Owned For
Owner Type
Purchase Details
Closed on
Apr 25, 2010
Sold by
Sd Seaport Lp
Bought by
Isaias Jesus Valencia
Current Estimated Value
Home Financials for this Owner
Home Financials are based on the most recent Mortgage that was taken out on this home.
Original Mortgage
$237,616
Interest Rate
4.87%
Mortgage Type
FHA
Purchase Details
Closed on
Aug 27, 2009
Sold by
Bungay Sylva Joseph
Bought by
Sd Seaport Lp
Purchase Details
Closed on
Aug 18, 2003
Sold by
Agliam Romeo S
Bought by
Bungay Sylvia Joseph
Home Financials for this Owner
Home Financials are based on the most recent Mortgage that was taken out on this home.
Original Mortgage
$240,000
Interest Rate
8.4%
Mortgage Type
Purchase Money Mortgage
Purchase Details
Closed on
May 21, 2002
Sold by
Agliam Romeo S
Bought by
Agliam Romeo S and Bungay Sylva Joseph
Create a Home Valuation Report for This Property
The Home Valuation Report is an in-depth analysis detailing your home's value as well as a comparison with similar homes in the area
Home Values in the Area
Average Home Value in this Area
Purchase History
| Date | Buyer | Sale Price | Title Company |
|---|---|---|---|
| Isaias Jesus Valencia | $242,000 | Stewart Title Of Ca Inc | |
| Sd Seaport Lp | $146,250 | Accommodation | |
| Bungay Sylvia Joseph | -- | North American Title Co | |
| Agliam Romeo S | -- | -- |
Source: Public Records
Mortgage History
| Date | Status | Borrower | Loan Amount |
|---|---|---|---|
| Previous Owner | Isaias Jesus Valencia | $237,616 | |
| Previous Owner | Bungay Sylvia Joseph | $240,000 |
Source: Public Records
Tax History Compared to Growth
Tax History
| Year | Tax Paid | Tax Assessment Tax Assessment Total Assessment is a certain percentage of the fair market value that is determined by local assessors to be the total taxable value of land and additions on the property. | Land | Improvement |
|---|---|---|---|---|
| 2025 | $3,630 | $312,360 | $163,279 | $149,081 |
| 2024 | $3,630 | $306,236 | $160,078 | $146,158 |
| 2023 | $3,580 | $300,233 | $156,940 | $143,293 |
| 2022 | $3,477 | $294,347 | $153,863 | $140,484 |
| 2021 | $3,397 | $288,577 | $150,847 | $137,730 |
| 2020 | $3,317 | $285,619 | $149,301 | $136,318 |
| 2019 | $3,232 | $280,020 | $146,374 | $133,646 |
| 2018 | $3,182 | $274,530 | $143,504 | $131,026 |
| 2017 | $3,115 | $269,148 | $140,691 | $128,457 |
| 2016 | $3,043 | $263,872 | $137,933 | $125,939 |
| 2015 | $3,000 | $259,910 | $135,862 | $124,048 |
| 2014 | $2,950 | $254,820 | $133,201 | $121,619 |
Source: Public Records
Map
Nearby Homes
- 3971 Caseman Ave
- 4026 Coleman Ave
- 1196 Danober Dr
- 3672 Byrd St
- 4250 Lemonseed Dr
- 3470 Robb Roy Place
- 3443 Alonquin Way
- 823 Fuchsia Ln
- 414 Palm Ave
- 3206 Caminito Quixote
- 3546 Del Sol Blvd Unit A
- 768 Picador Blvd
- 3124 Caminito Quixote
- 1011 Beyer Way Unit 32
- 3474 Del Sol Blvd Unit C
- 3414 Del Sol Blvd Unit A
- 321 Palm Ave
- 3340 Del Sol Blvd Unit 268
- 3340 Del Sol Blvd Unit 144
- 3340 Del Sol Blvd Unit SPC 126
- 882 Joshua Place
- 873 Piccard Ave
- 890 Joshua Place
- 881 Piccard Ave
- 3922 Coldwell Ln
- 3955 Coldwell Ln
- 3932 Coldwell Ln
- 891 Piccard Ave
- 3912 Coldwell Ln
- 898 Joshua Place
- 3942 Coldwell Ln
- 3950 Daves Way
- 3904 Coldwell Ln
- 899 Piccard Ave
- 3963 Coldwell Ln
- 3950 Coldwell Ln
- 912 Joshua Place
- 3958 Daves Way
- 3927 Glading Dr
- 911 Piccard Ave