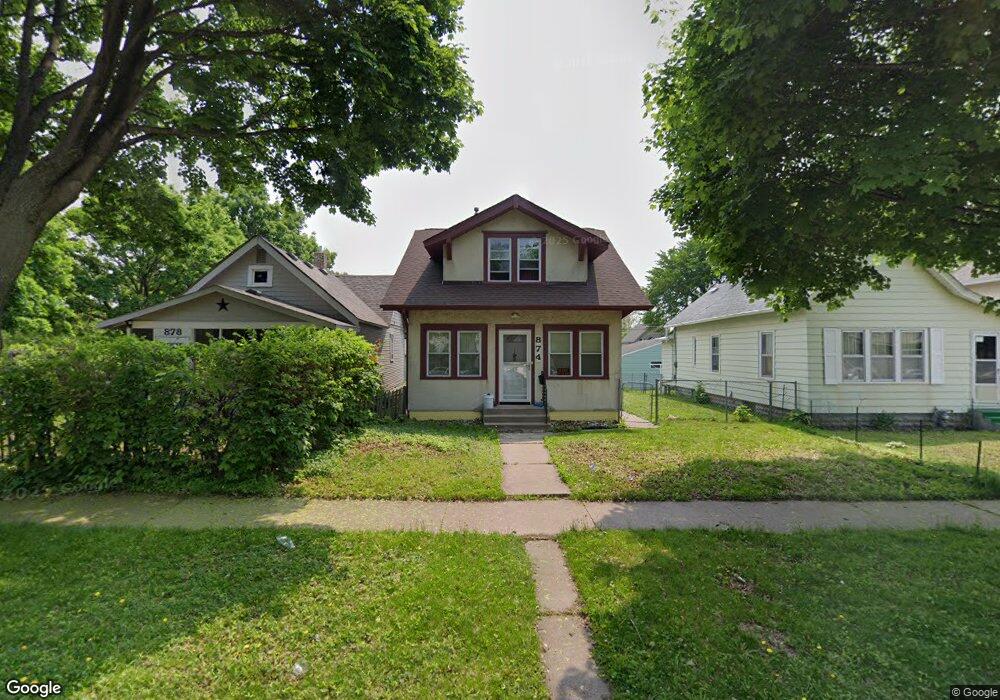
874 Magnolia Ave E Saint Paul, MN 55106
Payne-Phalen NeighborhoodEstimated Value: $205,000 - $228,000
4
Beds
2
Baths
1,260
Sq Ft
$170/Sq Ft
Est. Value
About This Home
This home is located at 874 Magnolia Ave E, Saint Paul, MN 55106 and is currently estimated at $214,480, approximately $170 per square foot. 874 Magnolia Ave E is a home located in Ramsey County with nearby schools including Frost Lake Elementary School, Battle Creek Middle School, and Johnson Senior High School.
Ownership History
Date
Name
Owned For
Owner Type
Purchase Details
Closed on
Mar 10, 2022
Sold by
Xiang Kao Y
Bought by
Simpson Joshua
Current Estimated Value
Home Financials for this Owner
Home Financials are based on the most recent Mortgage that was taken out on this home.
Original Mortgage
$180,500
Outstanding Balance
$167,429
Interest Rate
3.92%
Mortgage Type
New Conventional
Estimated Equity
$47,051
Purchase Details
Closed on
Aug 15, 2018
Sold by
Moua Pa
Bought by
Xiong Kao Y
Home Financials for this Owner
Home Financials are based on the most recent Mortgage that was taken out on this home.
Original Mortgage
$155,103
Interest Rate
4.5%
Mortgage Type
New Conventional
Purchase Details
Closed on
Aug 13, 2018
Sold by
Khang Xiong
Bought by
Moua Pa
Home Financials for this Owner
Home Financials are based on the most recent Mortgage that was taken out on this home.
Original Mortgage
$155,103
Interest Rate
4.5%
Mortgage Type
New Conventional
Purchase Details
Closed on
Jul 20, 2015
Sold by
Mcmonigal Lawrence A and Mcmonigal Judith A
Bought by
Moua Pa
Home Financials for this Owner
Home Financials are based on the most recent Mortgage that was taken out on this home.
Original Mortgage
$127,546
Interest Rate
4.02%
Mortgage Type
FHA
Create a Home Valuation Report for This Property
The Home Valuation Report is an in-depth analysis detailing your home's value as well as a comparison with similar homes in the area
Home Values in the Area
Average Home Value in this Area
Purchase History
| Date | Buyer | Sale Price | Title Company |
|---|---|---|---|
| Simpson Joshua | $190,000 | Edgewater Title | |
| Xiong Kao Y | $164,745 | First American Title Ins Co | |
| Moua Pa | -- | First American Title Ins Co | |
| Moua Pa | $133,636 | Global Cloisng & Title Servi |
Source: Public Records
Mortgage History
| Date | Status | Borrower | Loan Amount |
|---|---|---|---|
| Open | Simpson Joshua | $180,500 | |
| Previous Owner | Xiong Kao Y | $155,103 | |
| Previous Owner | Moua Pa | $127,546 |
Source: Public Records
Tax History
| Year | Tax Paid | Tax Assessment Tax Assessment Total Assessment is a certain percentage of the fair market value that is determined by local assessors to be the total taxable value of land and additions on the property. | Land | Improvement |
|---|---|---|---|---|
| 2025 | $3,514 | $223,300 | $25,000 | $198,300 |
| 2024 | $3,514 | $211,600 | $25,000 | $186,600 |
| 2023 | $3,514 | $214,500 | $20,000 | $194,500 |
| 2022 | $2,798 | $204,600 | $20,000 | $184,600 |
| 2021 | $2,080 | $169,700 | $20,000 | $149,700 |
| 2020 | $2,380 | $150,400 | $10,000 | $140,400 |
| 2019 | $2,406 | $150,400 | $10,000 | $140,400 |
| 2018 | $1,836 | $150,400 | $10,000 | $140,400 |
| 2017 | $1,670 | $130,800 | $10,000 | $120,800 |
| 2016 | $1,232 | $0 | $0 | $0 |
| 2015 | $1,120 | $92,600 | $10,000 | $82,600 |
| 2014 | $1,170 | $0 | $0 | $0 |
Source: Public Records
Map
Nearby Homes
- 878 Magnolia Ave E
- 869 Lawson Ave E
- 904 Jessamine Ave E
- 864 Lawson Ave E
- 893 Jenks Ave
- 813 Jessamine Ave E
- 911 Jenks Ave E
- 790 Geranium Ave E
- 895 Rose Ave E
- 973 Jessamine Ave E
- 970 Geranium Ave E
- 915 Rose Ave E
- 782 Rose Ave E
- 751 Lawson Ave E
- 982 Geranium Ave E
- 911 Sims Ave
- 758 Jenks Ave
- 930 Hawthorne Ave E
- 748 Case Ave E
- 1045 Magnolia Ave E
- 872 Magnolia Ave E
- 866 Magnolia Ave E
- 866 866 Magnolia Ave E
- 862 Magnolia Ave E
- 873 Cook Ave E
- 873 873 Cook-Avenue-e
- 869 869 Cook Ave E
- 869 Cook Ave E
- 856 Magnolia Ave E
- 875 Cook Ave E
- 865 Cook Ave E
- 861 Cook Ave E
- 871 Magnolia Ave E
- 867 Magnolia Ave E
- 867 867 Magnolia Ave E
- 875 Magnolia Ave E
- 852 Magnolia Ave E
- 865 Magnolia Ave E
- 859 859 Magnolia-Avenue-e
- 855 Cook Ave E
Your Personal Tour Guide
Ask me questions while you tour the home.