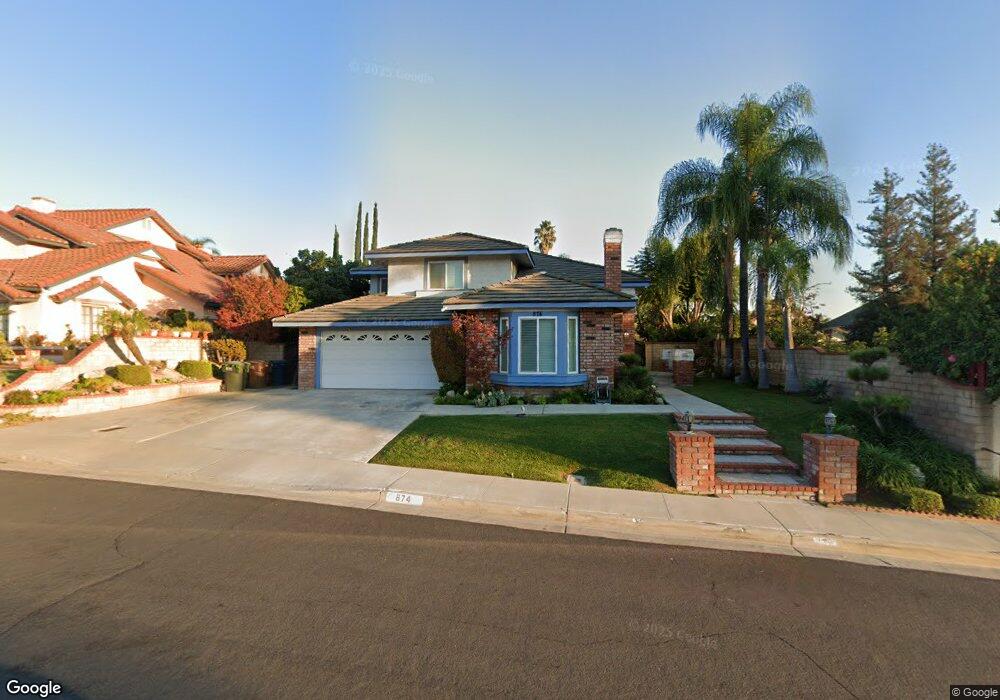
874 San Nicholas Dr Walnut, CA 91789
Estimated Value: $1,207,347 - $1,354,000
4
Beds
3
Baths
2,084
Sq Ft
$619/Sq Ft
Est. Value
About This Home
This home is located at 874 San Nicholas Dr, Walnut, CA 91789 and is currently estimated at $1,290,587, approximately $619 per square foot. 874 San Nicholas Dr is a home located in Los Angeles County with nearby schools including Stanley G. Oswalt Academy, Nogales High School, and Bright Star Montessori Academy.
Ownership History
Date
Name
Owned For
Owner Type
Purchase Details
Closed on
Jul 30, 2019
Sold by
Mai Michael and Le Jennifer
Bought by
Mai Michael and Le Jennifer
Current Estimated Value
Purchase Details
Closed on
Oct 7, 2009
Sold by
Le Sam and Dong Van
Bought by
Mai Michael and Le Jennifer
Home Financials for this Owner
Home Financials are based on the most recent Mortgage that was taken out on this home.
Original Mortgage
$500,000
Interest Rate
5.02%
Mortgage Type
New Conventional
Purchase Details
Closed on
Oct 25, 2005
Sold by
Vanle Sam and Dong Van Thi
Bought by
The Sam Le & Van Dong Joint Living Trust
Purchase Details
Closed on
Aug 8, 1994
Sold by
Chan Shuk Ching and Chan Kam Yin
Bought by
Vanle Sam Van and Le Van Thi Dong
Home Financials for this Owner
Home Financials are based on the most recent Mortgage that was taken out on this home.
Original Mortgage
$100,000
Interest Rate
8.65%
Create a Home Valuation Report for This Property
The Home Valuation Report is an in-depth analysis detailing your home's value as well as a comparison with similar homes in the area
Home Values in the Area
Average Home Value in this Area
Purchase History
We collect this data history from publicly available records. To have your information removed, we recommend requesting removal directly through your county’s website.
| Date | Buyer | Sale Price | Title Company |
|---|---|---|---|
| Mai Michael | -- | None Available | |
| Mai Michael | $626,000 | Ticor Title Tustin Orange Co | |
| The Sam Le & Van Dong Joint Living Trust | -- | -- | |
| Vanle Sam Van | $255,000 | Title Land Company |
Source: Public Records
Mortgage History
We collect this data history from publicly available records. To have your information removed, we recommend requesting removal directly through your county’s website.
| Date | Status | Borrower | Loan Amount |
|---|---|---|---|
| Previous Owner | Mai Michael | $500,000 | |
| Previous Owner | Vanle Sam Van | $100,000 |
Source: Public Records
Tax History
| Year | Tax Paid | Tax Assessment Tax Assessment Total Assessment is a certain percentage of the fair market value that is determined by local assessors to be the total taxable value of land and additions on the property. | Land | Improvement |
|---|---|---|---|---|
| 2025 | $10,563 | $808,041 | $318,439 | $489,602 |
| 2024 | $10,176 | $792,198 | $312,196 | $480,002 |
| 2023 | $9,834 | $776,666 | $306,075 | $470,591 |
| 2022 | $9,625 | $761,438 | $300,074 | $461,364 |
| 2021 | $9,470 | $746,509 | $294,191 | $452,318 |
| 2019 | $9,189 | $724,369 | $285,466 | $438,903 |
| 2018 | $8,858 | $710,167 | $279,869 | $430,298 |
| 2016 | $8,537 | $682,592 | $269,002 | $413,590 |
| 2015 | $8,399 | $672,340 | $264,962 | $407,378 |
| 2014 | $8,380 | $659,171 | $259,772 | $399,399 |
Source: Public Records
Map
Nearby Homes
- 19200 Kamlyn Ln
- 535 San Roque Dr
- 19717 Los Pinos Dr
- 19910 Tennessee Trail
- 19668 Three Oaks Ln
- 19678 Three Oaks Ln
- 831 Colusa Dr
- 438 Calle Alcazar
- 19201 Lydle Creek Place
- 1468 Pierre Rd
- 1050 N High Knoll Ln
- 19569 Vista Hermosa Dr
- 19933 Ralph St
- 448 Acaso Dr
- 340 Calle Caballeros
- 0 Meadow Pass Rd
- 540 Citadel Dr
- 19528 Morning Grove Ln
- 3332 La Puente Rd
- 886 Francesca Dr
- 882 San Nicholas Dr
- 19505 E Mira Loma Way
- 19511 E Mira Loma Way
- 803 Linda Ct
- 19517 E Mira Loma Way
- 807 Linda Ct
- 873 San Nicholas Dr
- 881 San Nicholas Dr
- 19525 E Mira Loma Way
- 865 San Nicholas Dr
- 889 San Nicholas Dr
- 800 Linda Ct
- 19533 E Mira Loma Way
- 857 San Nicholas Dr
- 19504 E Mira Loma Way
- 19512 E Mira Loma Way
- 950 Barcelona Place
- 884 N San Miguel Rd
- 888 N San Miguel Rd
- 890 N San Miguel Rd
Your Personal Tour Guide
Ask me questions while you tour the home.