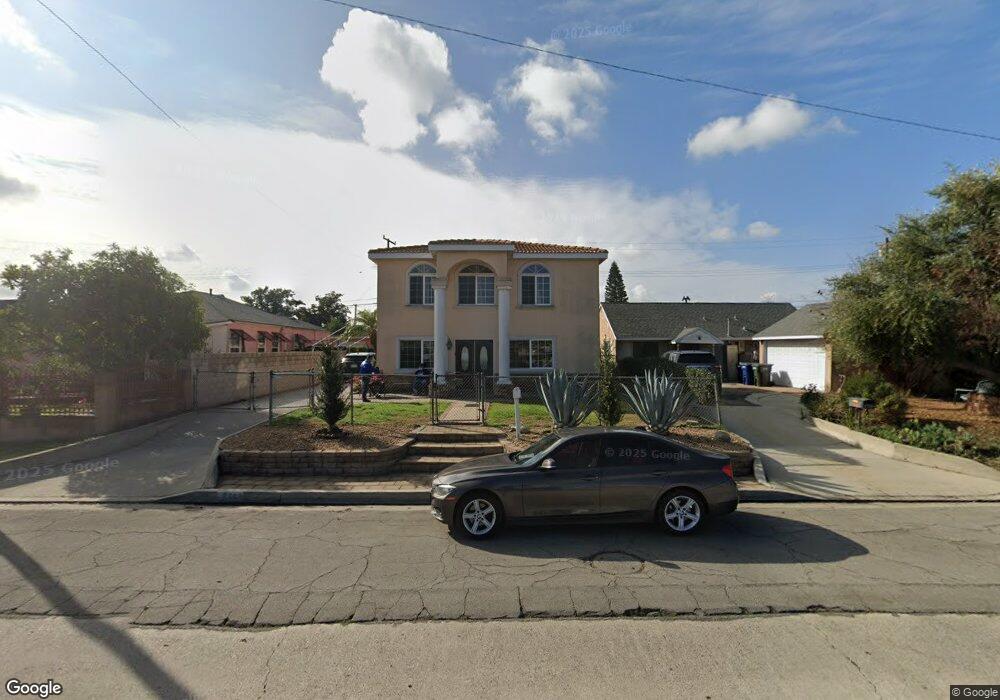
8742 Beverly Rd Pico Rivera, CA 90660
Estimated Value: $684,000 - $799,361
3
Beds
2
Baths
1,914
Sq Ft
$390/Sq Ft
Est. Value
About This Home
This home is located at 8742 Beverly Rd, Pico Rivera, CA 90660 and is currently estimated at $746,340, approximately $389 per square foot. 8742 Beverly Rd is a home located in Los Angeles County with nearby schools including North Ranchito Elementary School, North Park Middle School, and Ruben Salazar Continuation School.
Ownership History
Date
Name
Owned For
Owner Type
Purchase Details
Closed on
Mar 7, 2000
Sold by
Hud
Bought by
Landin Eligio B
Current Estimated Value
Home Financials for this Owner
Home Financials are based on the most recent Mortgage that was taken out on this home.
Original Mortgage
$118,750
Outstanding Balance
$40,506
Interest Rate
8.38%
Estimated Equity
$705,834
Purchase Details
Closed on
Dec 16, 1999
Sold by
Norwest Mtg Inc
Bought by
Hud
Purchase Details
Closed on
Jul 15, 1999
Sold by
Barragan Jose and Barragan Ernestina
Bought by
Norwest Mtg Inc
Purchase Details
Closed on
May 19, 1995
Sold by
Graham Linda and Saucedo Susana B
Bought by
Barragan Jose
Home Financials for this Owner
Home Financials are based on the most recent Mortgage that was taken out on this home.
Original Mortgage
$131,442
Interest Rate
8.32%
Mortgage Type
FHA
Create a Home Valuation Report for This Property
The Home Valuation Report is an in-depth analysis detailing your home's value as well as a comparison with similar homes in the area
Home Values in the Area
Average Home Value in this Area
Purchase History
| Date | Buyer | Sale Price | Title Company |
|---|---|---|---|
| Landin Eligio B | $125,000 | Stewart Title | |
| Hud | -- | First American Title Ins Co | |
| Norwest Mtg Inc | $162,717 | First American Title Ins Co | |
| Barragan Jose | $133,000 | North American Title |
Source: Public Records
Mortgage History
| Date | Status | Borrower | Loan Amount |
|---|---|---|---|
| Open | Landin Eligio B | $118,750 | |
| Previous Owner | Barragan Jose | $131,442 |
Source: Public Records
Tax History
| Year | Tax Paid | Tax Assessment Tax Assessment Total Assessment is a certain percentage of the fair market value that is determined by local assessors to be the total taxable value of land and additions on the property. | Land | Improvement |
|---|---|---|---|---|
| 2025 | $4,436 | $287,005 | $147,843 | $139,162 |
| 2024 | $4,436 | $281,379 | $144,945 | $136,434 |
| 2023 | $4,317 | $275,862 | $142,103 | $133,759 |
| 2022 | $4,129 | $270,454 | $139,317 | $131,137 |
| 2021 | $4,012 | $265,152 | $136,586 | $128,566 |
| 2019 | $3,984 | $257,289 | $132,536 | $124,753 |
| 2018 | $3,748 | $252,245 | $129,938 | $122,307 |
| 2016 | $3,383 | $242,452 | $124,894 | $117,558 |
| 2015 | $3,334 | $238,811 | $123,018 | $115,793 |
| 2014 | $3,296 | $234,134 | $120,609 | $113,525 |
Source: Public Records
Map
Nearby Homes
- 4660 Paramount Blvd
- 8630 Elba St
- 4424 Calada Ave
- 8509 Beverly Blvd Unit 76
- 8509 Beverly Blvd Unit 24
- 8509 Beverly Blvd Unit 74
- 4288 Rosemead Blvd Unit 25
- 9035 Hightree St
- 8835 Las Posas St
- 4508 Deland Ave
- 4918 Rosemead Blvd
- 4724 Orange St
- 4139 Paramount Blvd Unit 18
- 4753 Orange St
- 9323 Via Azul
- 9327 Via Azul
- 9329 Via Azul
- 9318 Via Azul
- 9335 Via Azul
- 9324 Via Azul
- 8738 Beverly Rd
- 8802 Beverly Rd
- 8808 Beverly Rd
- 8732 Beverly Rd
- 8733 Elba St
- 8739 Elba St
- 8729 Elba St
- 8728 Beverly Rd
- 8812 Beverly Rd
- 8743 Elba St
- 8723 Elba St
- 4572 Los Toros Ave
- 4649 Bridgeview Ave
- 8749 Elba St
- 8719 Elba St
- 8722 Beverly Rd
- 8818 Beverly Rd
- 4569 Bridgeview Ave
- 8713 Elba St
- 4575 Los Toros Ave
Your Personal Tour Guide
Ask me questions while you tour the home.