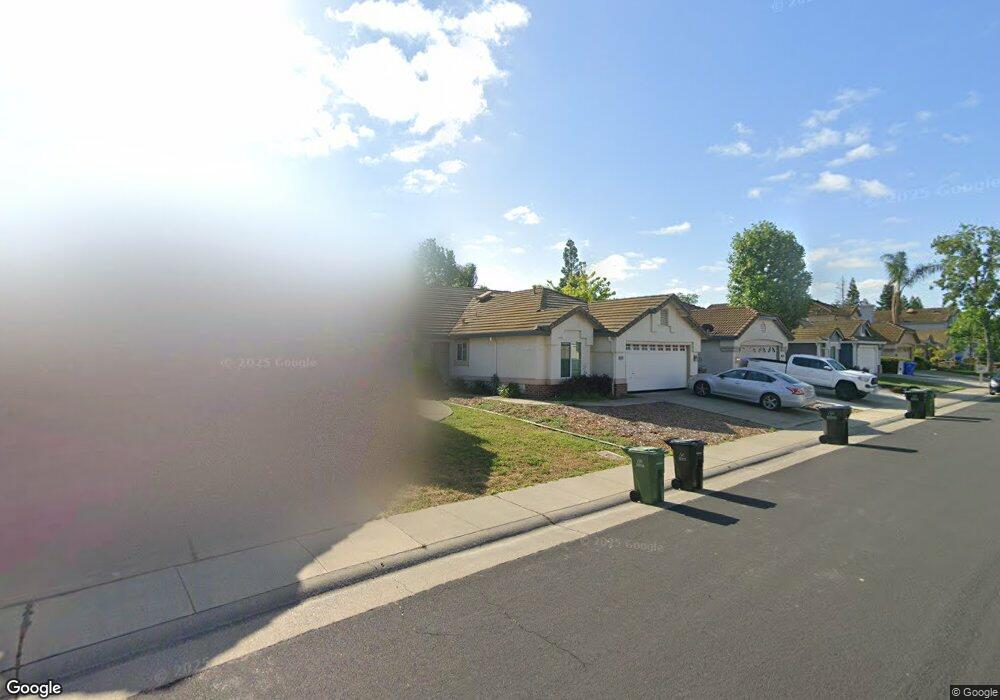
8743 Mesa Brook Way Elk Grove, CA 95624
North East Elk Grove NeighborhoodEstimated Value: $546,202 - $604,000
4
Beds
2
Baths
1,715
Sq Ft
$335/Sq Ft
Est. Value
About This Home
This home is located at 8743 Mesa Brook Way, Elk Grove, CA 95624 and is currently estimated at $573,801, approximately $334 per square foot. 8743 Mesa Brook Way is a home located in Sacramento County with nearby schools including Raymond Case Elementary School, Edward Harris Jr. Middle School, and Monterey Trail High School.
Ownership History
Date
Name
Owned For
Owner Type
Purchase Details
Closed on
Feb 26, 2003
Sold by
Ramsey Stephen T and Ramsey Christine
Bought by
Warp A Craig and Warp Mary F
Current Estimated Value
Home Financials for this Owner
Home Financials are based on the most recent Mortgage that was taken out on this home.
Original Mortgage
$105,000
Outstanding Balance
$45,304
Interest Rate
5.93%
Estimated Equity
$528,497
Purchase Details
Closed on
Jul 5, 2001
Sold by
Ramsey Stephen T and Ramsey Christine
Bought by
Ramsey Stephen T and Ramsey Christine
Home Financials for this Owner
Home Financials are based on the most recent Mortgage that was taken out on this home.
Original Mortgage
$163,000
Interest Rate
7.64%
Purchase Details
Closed on
Feb 10, 1995
Sold by
U S Home Corp
Bought by
Donohue Christine and Ramsey Stephen T
Home Financials for this Owner
Home Financials are based on the most recent Mortgage that was taken out on this home.
Original Mortgage
$138,497
Interest Rate
9.21%
Mortgage Type
FHA
Create a Home Valuation Report for This Property
The Home Valuation Report is an in-depth analysis detailing your home's value as well as a comparison with similar homes in the area
Home Values in the Area
Average Home Value in this Area
Purchase History
| Date | Buyer | Sale Price | Title Company |
|---|---|---|---|
| Warp A Craig | $255,000 | Chicago Title Company | |
| Ramsey Stephen T | -- | Financial Title Company | |
| Donohue Christine | $143,500 | Stewart Title |
Source: Public Records
Mortgage History
| Date | Status | Borrower | Loan Amount |
|---|---|---|---|
| Open | Warp A Craig | $105,000 | |
| Previous Owner | Ramsey Stephen T | $163,000 | |
| Previous Owner | Donohue Christine | $138,497 |
Source: Public Records
Tax History Compared to Growth
Tax History
| Year | Tax Paid | Tax Assessment Tax Assessment Total Assessment is a certain percentage of the fair market value that is determined by local assessors to be the total taxable value of land and additions on the property. | Land | Improvement |
|---|---|---|---|---|
| 2025 | $4,142 | $369,303 | $108,613 | $260,690 |
| 2024 | $4,142 | $362,063 | $106,484 | $255,579 |
| 2023 | $4,036 | $354,965 | $104,397 | $250,568 |
| 2022 | $3,961 | $348,005 | $102,350 | $245,655 |
| 2021 | $3,906 | $341,183 | $100,344 | $240,839 |
| 2020 | $3,853 | $337,686 | $99,316 | $238,370 |
| 2019 | $3,781 | $331,066 | $97,369 | $233,697 |
| 2018 | $3,679 | $324,575 | $95,460 | $229,115 |
| 2017 | $3,614 | $318,212 | $93,589 | $224,623 |
| 2016 | $3,432 | $311,973 | $91,754 | $220,219 |
| 2015 | $3,369 | $307,288 | $90,376 | $216,912 |
| 2014 | $3,314 | $301,269 | $88,606 | $212,663 |
Source: Public Records
Map
Nearby Homes
- 8659 Tegea Way
- 8508 Cottonseed Way
- 8500 Brushwood Way
- 8504 Cottonseed Way
- 8500 Cottonseed Way
- 8449 Cottonseed Way
- 8668 Gossamer Way
- 8469 Brushwood Way
- 8770 Bottlebrush Ct
- 8951 Ivanpah Ct
- 8885 Springhurst Dr
- 8747 Gessnger Dr
- 8472 Kingsland Ct
- 8581 Petunia Way
- 8513 Sheldon North Dr
- 8822 Wheelton Rd
- 8360 Blackman Way
- 8679 Spring House Way
- 8890 Wheelton Rd
- 8817 J Sheehan St
- 8747 Mesa Brook Way
- 8739 Mesa Brook Way
- 8751 Mesa Brook Way
- 8756 Vytina Dr
- 8752 Vytina Dr
- 8604 June Bug Ct
- 8760 Vytina Dr
- 8755 Mesa Brook Way
- 8608 June Bug Ct
- 8742 Mesa Brook Way
- 8746 Mesa Brook Way
- 8748 Vytina Dr
- 8738 Mesa Brook Way
- 8764 Vytina Dr
- 8750 Mesa Brook Way
- 8759 Mesa Brook Way
- 8734 Mesa Brook Way
- 8754 Mesa Brook Way
- 8744 Vytina Dr
- 8768 Vytina Dr