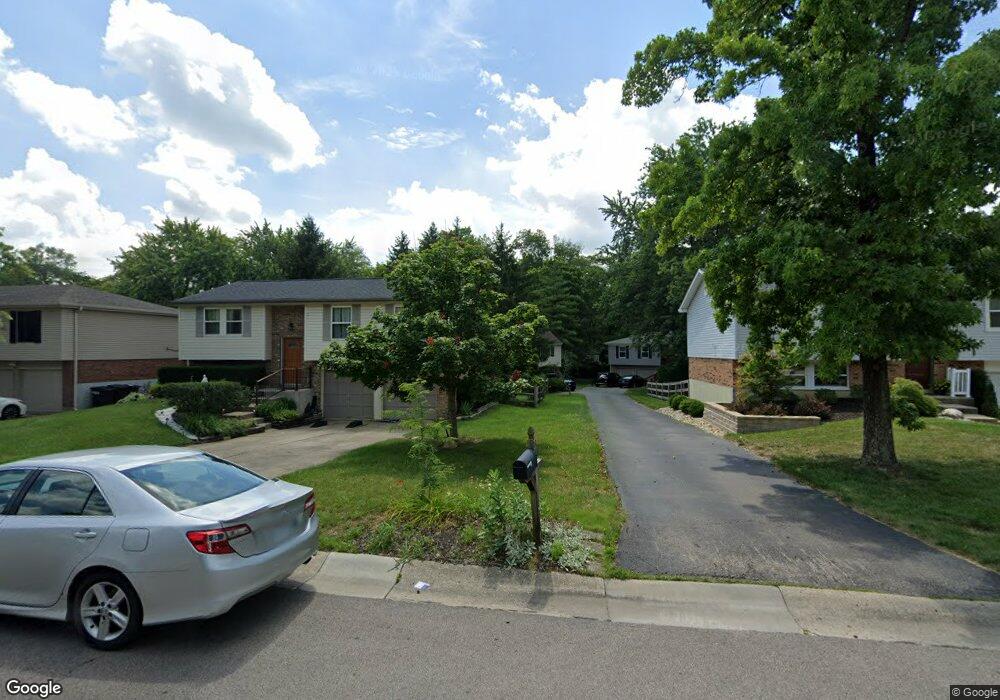
8744 Simpson Ct Mason, OH 45040
Landen NeighborhoodEstimated Value: $325,253 - $351,000
3
Beds
2
Baths
1,364
Sq Ft
$246/Sq Ft
Est. Value
About This Home
This home is located at 8744 Simpson Ct, Mason, OH 45040 and is currently estimated at $336,063, approximately $246 per square foot. 8744 Simpson Ct is a home located in Warren County with nearby schools including Kings Junior High School, Kings High School, and Montessori Academy of Cincinnati.
Ownership History
Date
Name
Owned For
Owner Type
Purchase Details
Closed on
Mar 28, 2019
Sold by
Boehm Jerome A
Bought by
Boehm Jerome A
Current Estimated Value
Purchase Details
Closed on
Jun 10, 2008
Sold by
Dreyer Judie A
Bought by
Boehm Jerome A
Home Financials for this Owner
Home Financials are based on the most recent Mortgage that was taken out on this home.
Original Mortgage
$55,225
Outstanding Balance
$35,510
Interest Rate
6.09%
Mortgage Type
Unknown
Estimated Equity
$300,553
Purchase Details
Closed on
May 26, 1999
Sold by
Winebrenner David R
Bought by
Dreyer Judie A
Home Financials for this Owner
Home Financials are based on the most recent Mortgage that was taken out on this home.
Original Mortgage
$102,000
Interest Rate
6.92%
Mortgage Type
New Conventional
Purchase Details
Closed on
Oct 5, 1987
Sold by
Abell Abell and Abell Joseph J
Bought by
Winebrenner & David R & Ch and Winebrenner David R
Purchase Details
Closed on
Jul 10, 1979
Sold by
Ryland Group Inc
Purchase Details
Closed on
Dec 19, 1978
Sold by
Landen Farm Co
Create a Home Valuation Report for This Property
The Home Valuation Report is an in-depth analysis detailing your home's value as well as a comparison with similar homes in the area
Home Values in the Area
Average Home Value in this Area
Purchase History
| Date | Buyer | Sale Price | Title Company |
|---|---|---|---|
| Boehm Jerome A | -- | None Available | |
| Boehm Jerome A | $155,000 | Vintage Title | |
| Dreyer Judie A | $120,000 | -- | |
| Winebrenner & David R & Ch | $75,000 | -- | |
| -- | $56,700 | -- | |
| -- | $20,300 | -- |
Source: Public Records
Mortgage History
| Date | Status | Borrower | Loan Amount |
|---|---|---|---|
| Open | Boehm Jerome A | $55,225 | |
| Previous Owner | Dreyer Judie A | $102,000 |
Source: Public Records
Tax History Compared to Growth
Tax History
| Year | Tax Paid | Tax Assessment Tax Assessment Total Assessment is a certain percentage of the fair market value that is determined by local assessors to be the total taxable value of land and additions on the property. | Land | Improvement |
|---|---|---|---|---|
| 2024 | $4,180 | $78,280 | $24,500 | $53,780 |
| 2023 | $3,608 | $60,581 | $12,915 | $47,666 |
| 2022 | $3,540 | $60,582 | $12,915 | $47,667 |
| 2021 | $2,975 | $60,582 | $12,915 | $47,667 |
| 2020 | $2,875 | $49,252 | $10,500 | $38,752 |
| 2019 | $2,837 | $49,252 | $10,500 | $38,752 |
| 2018 | $2,815 | $49,252 | $10,500 | $38,752 |
| 2017 | $2,964 | $45,794 | $10,371 | $35,424 |
| 2016 | $3,039 | $45,794 | $10,371 | $35,424 |
| 2015 | $2,577 | $45,794 | $10,371 | $35,424 |
| 2014 | $2,577 | $40,530 | $9,180 | $31,350 |
| 2013 | $2,581 | $46,370 | $10,500 | $35,870 |
Source: Public Records
Map
Nearby Homes
- 3833 Spring Mill Way
- 8650 Rocky Trail
- 8562 High Trail Ct
- 3536 Stoneboat Ct
- 8214 Winding Trail Place
- 4198 Oak Tree Ct
- 8732 Columbia Rd
- 3444 Cutter Ln
- 9623 Greenery Ct Unit 313B
- 9530 Greenery Ct Unit 305C
- 4230 Crestview Dr
- 8305 Woodbridge Ln
- 4027 Meadow Grove Ln
- 9723 Carriage Run Ct
- 8950 Wexford Place
- 8074 Big Oak Cir
- 2954 Mossy Brink Ct Unit 40
- 3204 Dogwood Ct N
- 8309 Marigold Ln
- 4000 Orchard Ln
- 8746 Simpson Ct
- 8720 Simpson Ct
- 8740 Simpson Ct
- 8742 Simpson Ct
- 8768 Simpson Ct
- 8764 Simpson Ct
- 8718 Simpson Ct
- 8714 Simpson Ct
- 8766 Simpson Ct
- 8696 Simpson Ct
- 8739 Simpson Ct
- 8749 Simpson Ct
- 8729 Simpson Ct
- 8700 Simpson Ct
- 8711 Simpson Ct
- 8759 Simpson Ct
- 8849 Creekwood Ln
- 8849 Creekwood Dr
- 8780 Simpson Ct
- 8847 Creekwood Dr