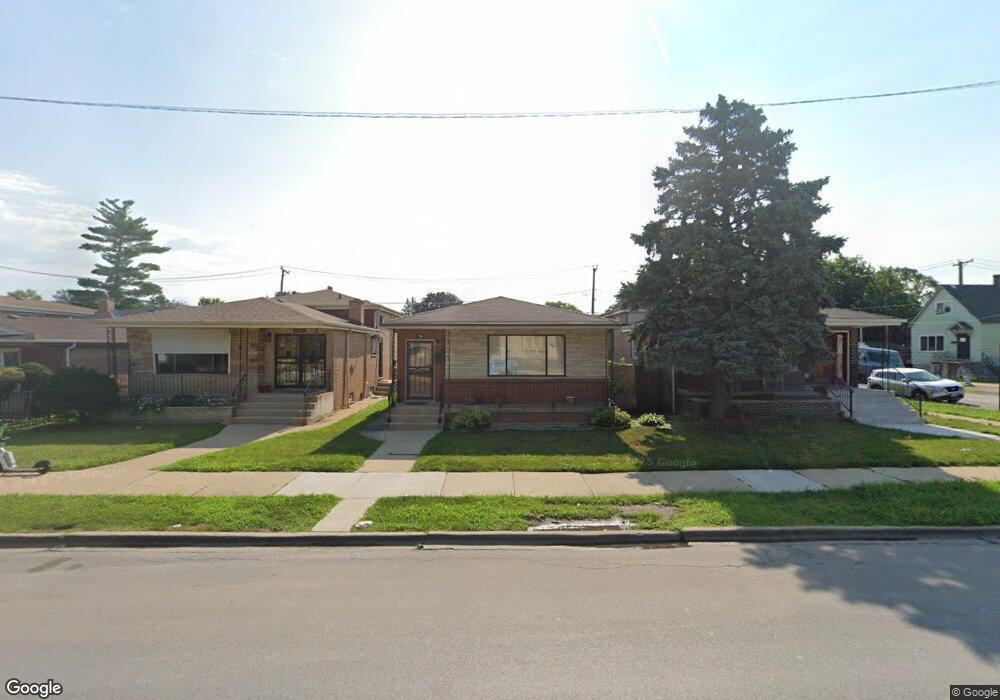
8745 S Halsted St Chicago, IL 60620
Auburn Gresham NeighborhoodEstimated Value: $181,000 - $272,000
3
Beds
2
Baths
1,295
Sq Ft
$164/Sq Ft
Est. Value
About This Home
This home is located at 8745 S Halsted St, Chicago, IL 60620 and is currently estimated at $212,180, approximately $163 per square foot. 8745 S Halsted St is a home located in Cook County with nearby schools including Ryder Elementary Math & Sci Spec School, Harlan Community Academy High School, and Hansberry College Prep.
Ownership History
Date
Name
Owned For
Owner Type
Purchase Details
Closed on
Mar 18, 2011
Sold by
Illinois Housing Development Authority
Bought by
Obazee Lucky
Current Estimated Value
Home Financials for this Owner
Home Financials are based on the most recent Mortgage that was taken out on this home.
Original Mortgage
$52,000
Outstanding Balance
$35,964
Interest Rate
4.93%
Mortgage Type
New Conventional
Estimated Equity
$176,216
Purchase Details
Closed on
Aug 9, 2010
Sold by
Bond Beverly
Bought by
Illinois Housing Development Authority
Purchase Details
Closed on
Jun 29, 2007
Sold by
Dantzler Thomas E
Bought by
Bond Beverly
Home Financials for this Owner
Home Financials are based on the most recent Mortgage that was taken out on this home.
Original Mortgage
$5,000
Interest Rate
6.73%
Mortgage Type
Unknown
Purchase Details
Closed on
May 24, 2000
Sold by
Lasalle Bank National Assn
Bought by
Dantzler Audrey
Create a Home Valuation Report for This Property
The Home Valuation Report is an in-depth analysis detailing your home's value as well as a comparison with similar homes in the area
Home Values in the Area
Average Home Value in this Area
Purchase History
| Date | Buyer | Sale Price | Title Company |
|---|---|---|---|
| Obazee Lucky | -- | Cti | |
| Illinois Housing Development Authority | -- | None Available | |
| Bond Beverly | $159,900 | Chicago Title Insurance Co | |
| Dantzler Audrey | -- | -- |
Source: Public Records
Mortgage History
| Date | Status | Borrower | Loan Amount |
|---|---|---|---|
| Open | Obazee Lucky | $52,000 | |
| Previous Owner | Bond Beverly | $5,000 |
Source: Public Records
Tax History Compared to Growth
Tax History
| Year | Tax Paid | Tax Assessment Tax Assessment Total Assessment is a certain percentage of the fair market value that is determined by local assessors to be the total taxable value of land and additions on the property. | Land | Improvement |
|---|---|---|---|---|
| 2024 | $1,480 | $12,000 | $3,419 | $8,581 |
| 2023 | $1,444 | $7,000 | $2,699 | $4,301 |
| 2022 | $1,444 | $7,000 | $2,699 | $4,301 |
| 2021 | $1,411 | $6,999 | $2,699 | $4,300 |
| 2020 | $1,937 | $8,673 | $2,699 | $5,974 |
| 2019 | $1,920 | $9,531 | $2,699 | $6,832 |
| 2018 | $1,887 | $9,531 | $2,699 | $6,832 |
| 2017 | $2,984 | $13,830 | $2,339 | $11,491 |
| 2016 | $2,777 | $13,830 | $2,339 | $11,491 |
| 2015 | $2,541 | $13,830 | $2,339 | $11,491 |
| 2014 | $2,433 | $13,081 | $2,159 | $10,922 |
| 2013 | $2,385 | $13,081 | $2,159 | $10,922 |
Source: Public Records
Map
Nearby Homes
- 738 W 87th St
- 8636 S Union Ave
- 8805 S Union Ave
- 8616 S Emerald Ave
- 8853 S Halsted St
- 8629 S Union Ave
- 8807 S Lowe Ave
- 8940 S Emerald Ave
- 8852 S Wallace St
- 8817 S Morgan St
- 8926 S Lowe Ave
- 8913 S Lowe Ave
- 9001-9003 S Wallace St
- 8855 S Wallace St
- 8558 S Sangamon St
- 8607 S Morgan St
- 8546 S Sangamon St
- 8009 S Halsted St
- 8943 S Lowe Ave
- 8663 S Vincennes Ave
- 8743 S Halsted St
- 8749 S Halsted St
- 8741 S Halsted St
- 8739 S Halsted St
- 8735 S Halsted St
- 8746 S Emerald Ave
- 8733 S Halsted St
- 8740 S Emerald Ave
- 8801 S Halsted St
- 8805-09 S Halsted St
- 8731 S Halsted St
- 8736 S Emerald Ave Unit 1
- 8746 S Halsted St
- 8744 S Halsted St
- 8740 S Halsted St
- 8727 S Halsted St
- 8802 S Emerald Ave
- 8805 S Halsted St
- 8734 S Emerald Ave Unit 2
- 8748 S Halsted St Unit 1