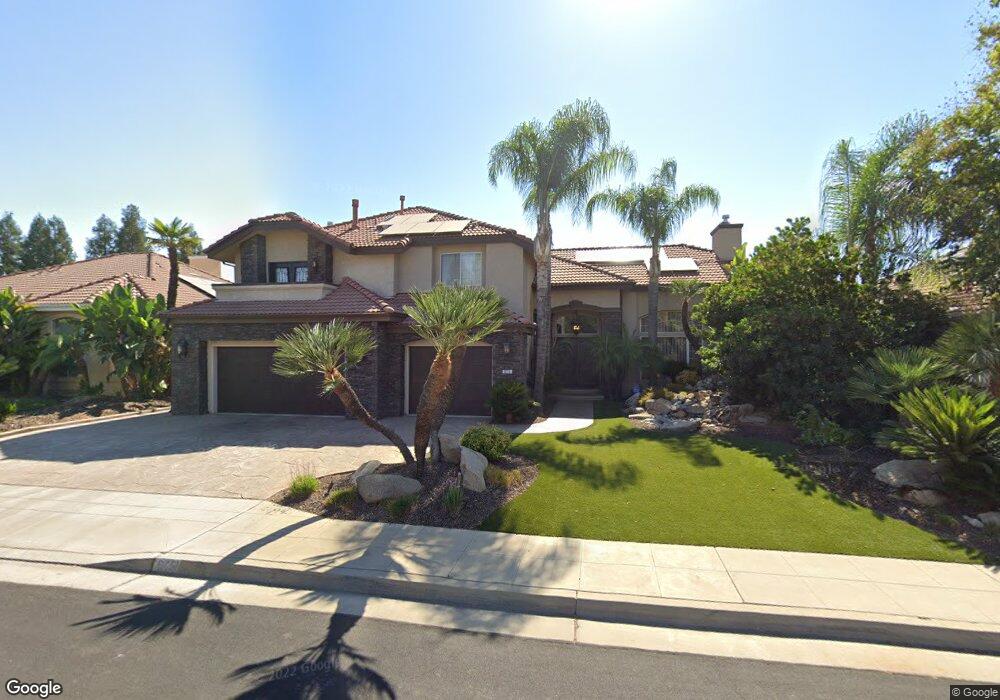
875 Carolina Ave Clovis, CA 93611
Estimated Value: $590,000 - $636,000
5
Beds
4
Baths
2,958
Sq Ft
$208/Sq Ft
Est. Value
About This Home
This home is located at 875 Carolina Ave, Clovis, CA 93611 and is currently estimated at $614,218, approximately $207 per square foot. 875 Carolina Ave is a home located in Fresno County with nearby schools including Clovis Elementary School, Clark Intermediate School, and Clovis High School.
Ownership History
Date
Name
Owned For
Owner Type
Purchase Details
Closed on
May 8, 2013
Sold by
Strack Brian
Bought by
Strack Cindy L
Current Estimated Value
Home Financials for this Owner
Home Financials are based on the most recent Mortgage that was taken out on this home.
Original Mortgage
$189,000
Outstanding Balance
$133,589
Interest Rate
3.5%
Mortgage Type
New Conventional
Estimated Equity
$480,629
Purchase Details
Closed on
Apr 10, 2013
Sold by
Hine Frank
Bought by
Strack Cindy L and Hine Cindy
Home Financials for this Owner
Home Financials are based on the most recent Mortgage that was taken out on this home.
Original Mortgage
$189,000
Outstanding Balance
$133,589
Interest Rate
3.5%
Mortgage Type
New Conventional
Estimated Equity
$480,629
Purchase Details
Closed on
Oct 6, 1993
Sold by
Westcal Inc
Bought by
Hine Frank and Hine Cindy
Home Financials for this Owner
Home Financials are based on the most recent Mortgage that was taken out on this home.
Original Mortgage
$145,100
Interest Rate
6.98%
Create a Home Valuation Report for This Property
The Home Valuation Report is an in-depth analysis detailing your home's value as well as a comparison with similar homes in the area
Home Values in the Area
Average Home Value in this Area
Purchase History
| Date | Buyer | Sale Price | Title Company |
|---|---|---|---|
| Strack Cindy L | -- | Placer Title Company | |
| Strack Cindy L | -- | Placer Title Company | |
| Hine Frank | $181,500 | Chicago Title Company |
Source: Public Records
Mortgage History
| Date | Status | Borrower | Loan Amount |
|---|---|---|---|
| Open | Strack Cindy L | $189,000 | |
| Closed | Hine Frank | $145,100 |
Source: Public Records
Tax History
| Year | Tax Paid | Tax Assessment Tax Assessment Total Assessment is a certain percentage of the fair market value that is determined by local assessors to be the total taxable value of land and additions on the property. | Land | Improvement |
|---|---|---|---|---|
| 2025 | $4,226 | $350,745 | $84,970 | $265,775 |
| 2023 | $4,054 | $337,126 | $81,671 | $255,455 |
| 2022 | $4,000 | $330,517 | $80,070 | $250,447 |
| 2021 | $3,891 | $324,037 | $78,500 | $245,537 |
| 2020 | $3,876 | $320,716 | $77,696 | $243,020 |
| 2019 | $3,802 | $314,428 | $76,173 | $238,255 |
| 2018 | $3,720 | $308,264 | $74,680 | $233,584 |
| 2017 | $3,645 | $302,220 | $73,216 | $229,004 |
| 2016 | $3,525 | $296,295 | $71,781 | $224,514 |
| 2015 | $3,414 | $276,920 | $70,703 | $206,217 |
| 2014 | $3,238 | $271,497 | $69,319 | $202,178 |
Source: Public Records
Map
Nearby Homes
- 793 Applegate Ave
- 2681 Wrenwood Ave
- 2691 Morris Ave
- 865 McKelvy Ave
- 637 Coventry Ave
- 2337 Wrenwood Ave
- 2871 Wrenwood Ave
- 2549 Purvis Ave
- 937 Filbert Ave
- 335 McKelvy Ave
- 344 McKelvy Ave
- 2963 Finchwood Ave
- 2034 Wrenwood Ave
- 2231 Escalon Ave
- 2668 Scott Ave
- 603 Kaweah Ave
- 2518 Keats Ave
- 2535 Sierra Ave
- 2216 Ellery Ave
- 2043 Escalon Ave
- 865 Carolina Ave
- 885 Carolina Ave
- 855 Carolina Ave
- 2580 Dovewood Ave
- 2581 Wrenwood Ave
- 895 Carolina Ave
- 835 Carolina Ave
- 2574 Dovewood Ave
- 2598 Wrenwood Ave
- 2571 Wrenwood Ave
- 832 Hanson Ave
- 852 Hanson Ave
- 2587 Dovewood Ave
- 2582 Wrenwood Ave
- 872 Hanson Ave
- 802 Hanson Ave
- 815 Carolina Ave
- 2560 Dovewood Ave
- 2561 Wrenwood Ave
- 2577 Dovewood Ave
Your Personal Tour Guide
Ask me questions while you tour the home.