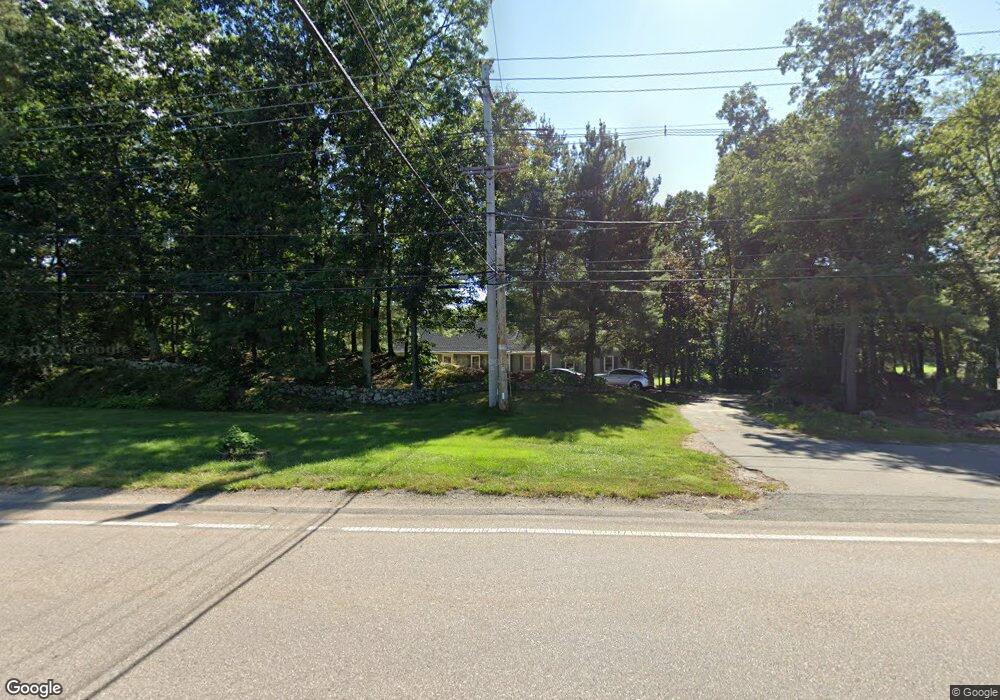
875 Franklin St Wrentham, MA 02093
Estimated Value: $903,309 - $964,000
3
Beds
3
Baths
2,418
Sq Ft
$386/Sq Ft
Est. Value
About This Home
This home is located at 875 Franklin St, Wrentham, MA 02093 and is currently estimated at $932,827, approximately $385 per square foot. 875 Franklin St is a home located in Norfolk County with nearby schools including Delaney Elementary School and Charles E Roderick.
Ownership History
Date
Name
Owned For
Owner Type
Purchase Details
Closed on
Aug 1, 2006
Sold by
Rodgers Donna M and Rodgers James D
Bought by
Babin Stephen E and Babin Susan J
Current Estimated Value
Home Financials for this Owner
Home Financials are based on the most recent Mortgage that was taken out on this home.
Original Mortgage
$170,000
Interest Rate
6.67%
Mortgage Type
Purchase Money Mortgage
Purchase Details
Closed on
Nov 2, 1998
Sold by
Murphy Paul G and Murphy Annette S
Bought by
Rodgers James D and Rodgers Donna M
Home Financials for this Owner
Home Financials are based on the most recent Mortgage that was taken out on this home.
Original Mortgage
$200,000
Interest Rate
6.68%
Mortgage Type
Purchase Money Mortgage
Purchase Details
Closed on
Jun 23, 1994
Sold by
Diplacido Dev Corp
Bought by
Murphy Paul G and Murphy Annette S
Create a Home Valuation Report for This Property
The Home Valuation Report is an in-depth analysis detailing your home's value as well as a comparison with similar homes in the area
Home Values in the Area
Average Home Value in this Area
Purchase History
| Date | Buyer | Sale Price | Title Company |
|---|---|---|---|
| Babin Stephen E | $590,000 | -- | |
| Rodgers James D | $300,000 | -- | |
| Murphy Paul G | $269,000 | -- |
Source: Public Records
Mortgage History
| Date | Status | Borrower | Loan Amount |
|---|---|---|---|
| Open | Murphy Paul G | $150,000 | |
| Closed | Murphy Paul G | $150,000 | |
| Closed | Babin Stephen E | $170,000 | |
| Previous Owner | Murphy Paul G | $200,000 |
Source: Public Records
Tax History Compared to Growth
Tax History
| Year | Tax Paid | Tax Assessment Tax Assessment Total Assessment is a certain percentage of the fair market value that is determined by local assessors to be the total taxable value of land and additions on the property. | Land | Improvement |
|---|---|---|---|---|
| 2025 | $9,547 | $823,700 | $288,600 | $535,100 |
| 2024 | $9,079 | $756,600 | $288,600 | $468,000 |
| 2023 | $9,379 | $743,200 | $262,500 | $480,700 |
| 2022 | $8,991 | $657,700 | $255,700 | $402,000 |
| 2021 | $8,735 | $620,800 | $239,000 | $381,800 |
| 2020 | $8,899 | $624,500 | $182,600 | $441,900 |
| 2019 | $8,496 | $601,700 | $182,600 | $419,100 |
| 2018 | $8,501 | $597,000 | $182,400 | $414,600 |
| 2017 | $8,262 | $579,800 | $178,900 | $400,900 |
| 2016 | $8,095 | $566,900 | $173,700 | $393,200 |
| 2015 | $8,116 | $541,800 | $167,000 | $374,800 |
| 2014 | $6,655 | $434,700 | $160,600 | $274,100 |
Source: Public Records
Map
Nearby Homes
- 570 Franklin St
- 50 Reed Fulton Ave Unit Lot 61
- 11 Elliot Mills Unit 11
- 12 Waites Crossing Way
- 131 Creek St Unit 7
- 70 Uncas Ave
- 64 Uncas Ave
- 45 Joshua Rd
- 1 Uncas Ave
- 82 Uncas Ave Unit 1
- 55 Lawrence Dr Unit 55
- 29 Lawrence Dr
- 159 E Central St
- 67 Milliken Ave Unit 22
- Lot 3 - 14 Earle Stewart Ln
- 0 Fall Ln
- 11 Earle Stewart Ln
- 40 Cross St
- 6 Woodchester Rd
- Lot 1 - Blueberry 2 Car Plan at King Philip Estates
- 881 Franklin St
- 865 Franklin St
- 880 Franklin St
- 885 Franklin St
- 20 Industrial Rd
- 886 Franklin St
- 887 Franklin St
- 850 Franklin St Unit 16
- 850 Franklin St
- 851 Franklin St Unit 8
- 851 Franklin St Unit 3
- 851 Franklin St Unit 4
- 25 Industrial Rd
- 895 Franklin St
- 844 Franklin St Unit 5A
- 844 Franklin St Unit 3 & 4
- 844 Franklin St
- 844 Franklin St Unit 1
- 844 Franklin St Unit 5
- 844 Franklin St Unit 7