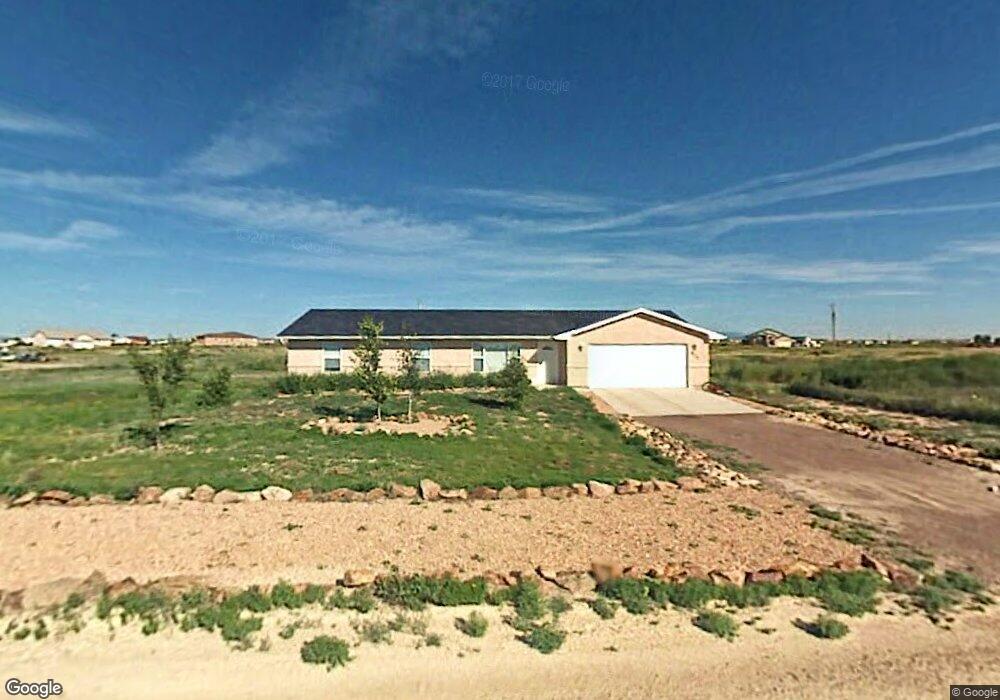
875 N Dillon Dr Unit 3 Pueblo, CO 81007
Estimated Value: $333,000 - $370,564
3
Beds
2
Baths
1,309
Sq Ft
$267/Sq Ft
Est. Value
About This Home
This home is located at 875 N Dillon Dr Unit 3, Pueblo, CO 81007 and is currently estimated at $349,641, approximately $267 per square foot. 875 N Dillon Dr Unit 3 is a home located in Pueblo County with nearby schools including Prairie Winds Elementary School, Liberty Point International School, and Pueblo West High School.
Ownership History
Date
Name
Owned For
Owner Type
Purchase Details
Closed on
Apr 12, 2013
Sold by
Trujillo Geraldine
Bought by
Santistevan Immanuel D and Trujillo Santistevan Geraldine L
Current Estimated Value
Home Financials for this Owner
Home Financials are based on the most recent Mortgage that was taken out on this home.
Original Mortgage
$111,290
Outstanding Balance
$51,655
Interest Rate
3.55%
Mortgage Type
New Conventional
Estimated Equity
$297,986
Purchase Details
Closed on
May 15, 2009
Sold by
Quint Kirby J and Quint Janice L
Bought by
Trujillo Geraldine
Home Financials for this Owner
Home Financials are based on the most recent Mortgage that was taken out on this home.
Original Mortgage
$108,989
Interest Rate
4.77%
Mortgage Type
FHA
Purchase Details
Closed on
Mar 25, 2005
Sold by
Quint Construction Inc
Bought by
Quint Kirby J and Quint Janice L
Create a Home Valuation Report for This Property
The Home Valuation Report is an in-depth analysis detailing your home's value as well as a comparison with similar homes in the area
Home Values in the Area
Average Home Value in this Area
Purchase History
| Date | Buyer | Sale Price | Title Company |
|---|---|---|---|
| Santistevan Immanuel D | -- | Land Title Guarantee Company | |
| Trujillo Geraldine | $111,000 | Stewart Title | |
| Quint Kirby J | -- | Stewart Title |
Source: Public Records
Mortgage History
| Date | Status | Borrower | Loan Amount |
|---|---|---|---|
| Open | Santistevan Immanuel D | $111,290 | |
| Closed | Trujillo Geraldine | $108,989 |
Source: Public Records
Tax History Compared to Growth
Tax History
| Year | Tax Paid | Tax Assessment Tax Assessment Total Assessment is a certain percentage of the fair market value that is determined by local assessors to be the total taxable value of land and additions on the property. | Land | Improvement |
|---|---|---|---|---|
| 2024 | $1,576 | $15,690 | -- | -- |
| 2023 | $1,594 | $19,380 | $3,230 | $16,150 |
| 2022 | $1,375 | $13,708 | $2,100 | $11,608 |
| 2021 | $1,410 | $14,100 | $2,160 | $11,940 |
| 2020 | $1,200 | $14,330 | $2,390 | $11,940 |
| 2019 | $1,197 | $11,975 | $644 | $11,331 |
| 2018 | $1,083 | $10,832 | $576 | $10,256 |
| 2017 | $1,084 | $10,832 | $576 | $10,256 |
| 2016 | $1,014 | $10,151 | $716 | $9,435 |
| 2015 | $1,006 | $10,151 | $716 | $9,435 |
| 2014 | $933 | $9,405 | $836 | $8,569 |
Source: Public Records
Map
Nearby Homes
- 806 N Monarch Dr
- 1045 E Jaroso Dr
- 803 N Ravencliff Dr
- 765 E Platteville Blvd
- 893 E Platteville Blvd
- 783 N Snyder Dr
- 773 Wendover Dr
- 923 E Platteville Blvd
- 729 Mapleleaf Dr
- 787 Edgewater Dr
- 292 N Purcell Blvd
- 882 N Durango Dr
- 1090 E Linda Ave
- 688 Maplelawn Dr
- 607 E Marigold Dr
- 1051 E Linda Ave
- 671 N Snyder Dr
- 633 N Iliff Dr
- 995 N Matt Dr
- 766 N Iliff Dr
- 875 N Dillon Dr
- 862 N Dillon Dr
- TBD N Dillon Dr
- 870 N Dillon Dr
- 859 N Dillon Dr
- 878 N Dillon Dr Unit 15
- 878 N Dillon Dr
- 886 N Dillon Dr
- 886 N Dillon Dr Unit 16
- 910 N Jaroso Dr Unit 11
- 892 E Jaroso Dr
- 918 N Jaroso Dr
- 934 E Jaroso Dr
- 854 N Dillon Dr Unit 12
- 854 N Dillon Dr
- 902 N Jaroso Dr
- 846 N Dillon Dr
- 846 N Dillon Dr Unit 11
- 803 E Longsdale Dr Unit 6
- 803 E Longsdale Dr