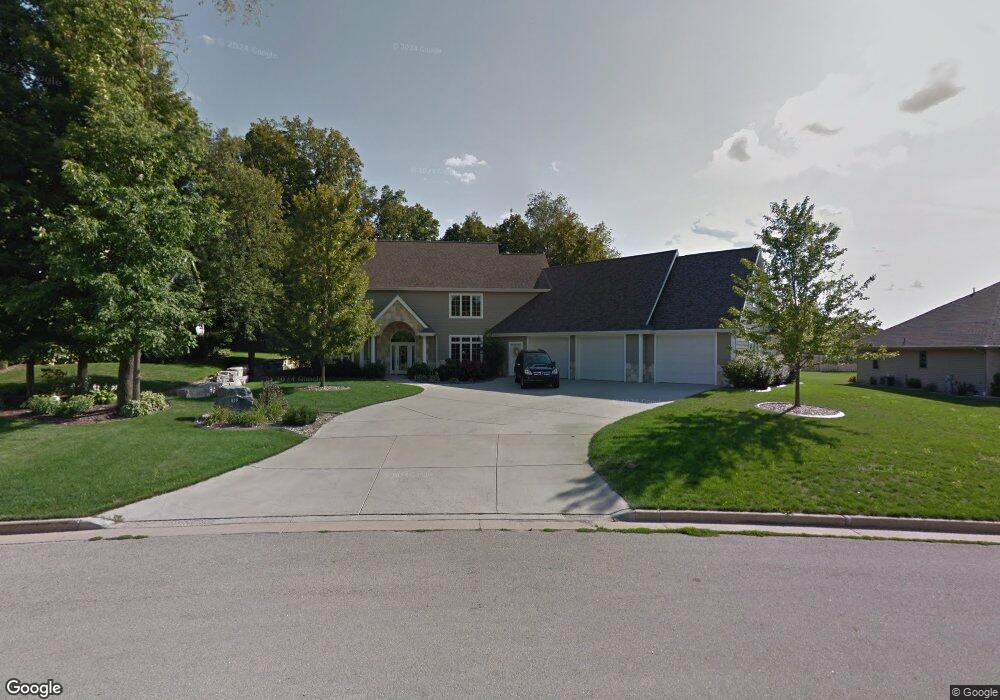
875 Windsong Way de Pere, WI 54115
Estimated Value: $520,000 - $729,558
4
Beds
4
Baths
3,792
Sq Ft
$171/Sq Ft
Est. Value
About This Home
This home is located at 875 Windsong Way, de Pere, WI 54115 and is currently estimated at $647,140, approximately $170 per square foot. 875 Windsong Way is a home located in Brown County with nearby schools including Hemlock Creek Elementary School, West De Pere Middle School, and West De Pere High School.
Ownership History
Date
Name
Owned For
Owner Type
Purchase Details
Closed on
Oct 18, 2013
Sold by
Kubiak David A
Bought by
Sanders Nathanial M and Sanders Kimberly A
Current Estimated Value
Home Financials for this Owner
Home Financials are based on the most recent Mortgage that was taken out on this home.
Original Mortgage
$275,793
Outstanding Balance
$210,176
Interest Rate
4.87%
Mortgage Type
FHA
Estimated Equity
$436,964
Purchase Details
Closed on
Nov 20, 2006
Sold by
Hendricks Mitchell R
Bought by
Kubiak David A
Purchase Details
Closed on
Jan 20, 2003
Sold by
Garot Keith E
Bought by
Dubois Jill M
Home Financials for this Owner
Home Financials are based on the most recent Mortgage that was taken out on this home.
Original Mortgage
$36,000
Interest Rate
6%
Create a Home Valuation Report for This Property
The Home Valuation Report is an in-depth analysis detailing your home's value as well as a comparison with similar homes in the area
Home Values in the Area
Average Home Value in this Area
Purchase History
| Date | Buyer | Sale Price | Title Company |
|---|---|---|---|
| Sanders Nathanial M | $375,000 | Title Revolution Llc | |
| Kubiak David A | $71,000 | Bay Title & Abstract Inc | |
| Dubois Jill M | $45,000 | Bay Title & Abstract |
Source: Public Records
Mortgage History
| Date | Status | Borrower | Loan Amount |
|---|---|---|---|
| Open | Sanders Nathanial M | $275,793 | |
| Previous Owner | Dubois Jill M | $36,000 |
Source: Public Records
Tax History Compared to Growth
Tax History
| Year | Tax Paid | Tax Assessment Tax Assessment Total Assessment is a certain percentage of the fair market value that is determined by local assessors to be the total taxable value of land and additions on the property. | Land | Improvement |
|---|---|---|---|---|
| 2024 | $8,169 | $544,400 | $60,900 | $483,500 |
| 2023 | $7,581 | $544,400 | $60,900 | $483,500 |
| 2022 | $7,629 | $544,400 | $60,900 | $483,500 |
| 2021 | $7,705 | $544,400 | $60,900 | $483,500 |
| 2020 | $7,395 | $380,000 | $41,500 | $338,500 |
| 2019 | $7,334 | $380,000 | $41,500 | $338,500 |
| 2018 | $6,986 | $380,000 | $41,500 | $338,500 |
| 2017 | $6,986 | $380,000 | $41,500 | $338,500 |
| 2016 | $7,084 | $380,000 | $41,500 | $338,500 |
| 2015 | $6,964 | $380,000 | $41,500 | $338,500 |
| 2014 | $7,501 | $380,000 | $41,500 | $338,500 |
| 2013 | $7,501 | $380,000 | $41,500 | $338,500 |
Source: Public Records
Map
Nearby Homes
- 0 Scheuring Rd
- 1595 Talus Cir
- 1108 Hoks Ridge Ln
- 1454 Navigator Way
- 1015 Nutmeg Dr
- 1372 Crossroads Dr
- 1378 Crossroads Dr
- 1021 Nutmeg Dr
- 1408 Crossroads Dr
- 1396 Crossroads Dr
- 1617 N Honeysuckle Dr
- 1359 Shelby Ln
- 1432 Crossroads Dr
- 1414 Crossroads Dr
- 1371 Crossroads Dr
- 1411 Crossroads Dr
- 1417 Crossroads Dr
- 1429 Crossroads Dr
- 1441 Crossroads Dr
- 1629 N Honeysuckle Dr
- 867 Windsong Way
- 883 Windsong Way
- 912 Chelsea Ct
- 904 Chelsea Ct
- 920 Chelsea Ct
- 850 Windsong Way
- 1635 Silhouette Ln
- 880 Windsong Way
- 859 Windsong Way
- 1643 Silhouette Ln
- 890 Windsong Way
- 826 Windsong Way
- 901 Chelsea Ct
- 841 Windsong Way
- 833 Windsong Way
- 1617 Silhouette Ln
- 818 Windsong Way
- 929 Chelsea Ct
- 909 Windsong Ct
- 1640 Silhouette Ln