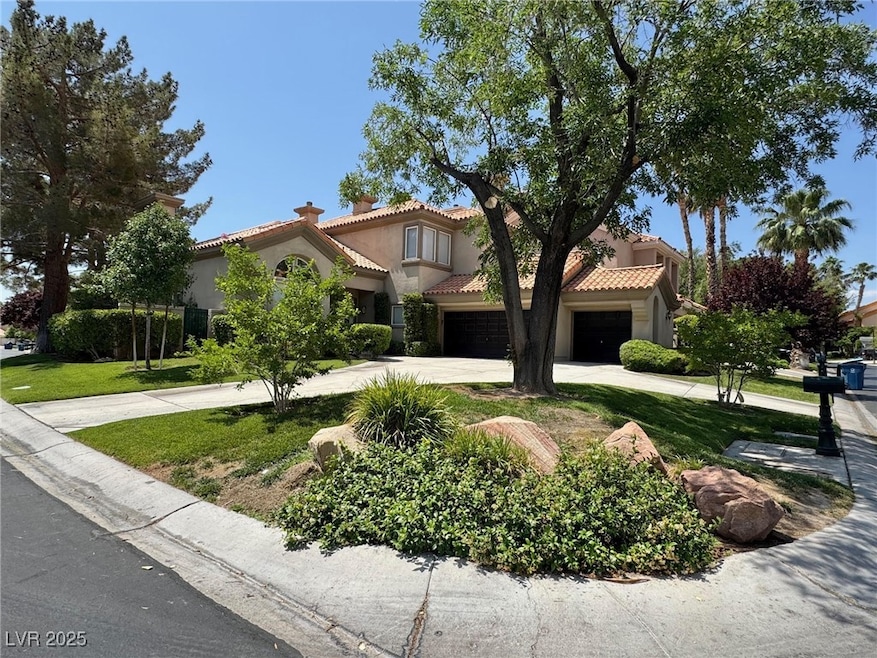

8753 Rainbow Ridge Dr Las Vegas, NV 89117
Canyon Gate NeighborhoodHighlights
- Golf Course Community
- Gated Community
- Fireplace in Bedroom
- Private Pool
- Clubhouse
- Tennis Courts
About This Home
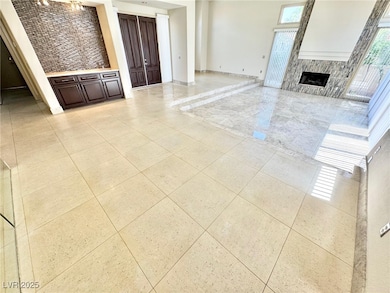
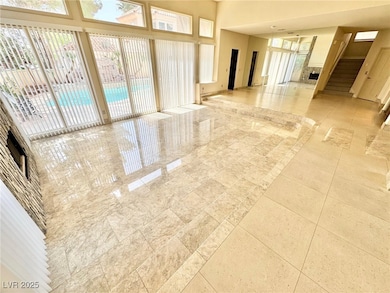
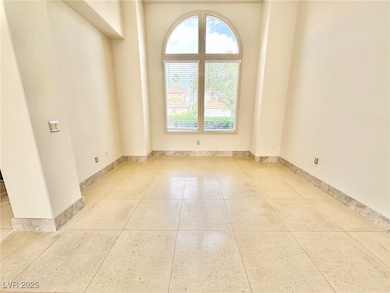
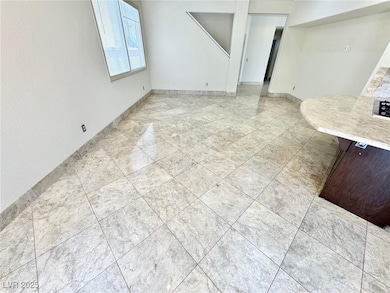
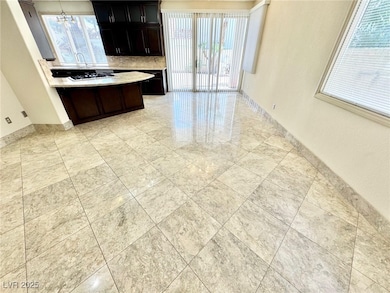
BEAUTIFUL TWO-STORY 4 BEDROOM 3 BATH HOME ON A CORNER LOT IN THE GUARD-GATED CANYON GATE COMMUNITY. THIS HOME FEATURES SOARING HIGH CEILINGS AND A FLOOR-TO-CEILING GLASS WALL WITH STUNNING VIEWS OF THE BACKYARD AND POOL. THE MAIN LEVEL OFFERS A FORMAL LIVING ROOM AND DINING ROOM ALONG WITH A SEPARATE FAMILY ROOM COMPLETE WITH A COZY FIREPLACE. THE SPACIOUS GOURMET KITCHEN BOASTS AMPLE COUNTER SPACE, A CENTRAL ISLAND, AND PLENTY OF ROOM FOR ENTERTAINING. THE PRIMARY SUITE IS A TRUE RETREAT WITH ITS OWN PRIVATE BALCONY, SECOND FIREPLACE, AND A SPA-INSPIRED BATHROOM FEATURING DUAL VANITIES, A SOAKING TUB, AND A SEPARATE WALK-IN SHOWER. OUTBACK, THE GORGEOUS LANDSCAPED YARD OFFERS A SPARKLING POOL, RELAXING SPA, AND PLENTY OF SPACE FOR FAMILY GATHERINGS OR ENTERTAINING. RESIDENTS ENJOY EASY ACCESS TO PREMIER SHOPPING, DINING, AND ENTERTAINMENT AT TIVOLI VILLAGE AND DOWNTOWN SUMMERLIN, AS WELL AS CITY NATIONAL ARENA AND THE LAS VEGAS BALLPARK.
Listing Agent
Brady Realty Group, LLC Brokerage Phone: 702-818-5500 License #B.0144554 Listed on: 06/05/2025
Home Details
Home Type
- Single Family
Est. Annual Taxes
- $5,821
Year Built
- Built in 1989
Lot Details
- 7,405 Sq Ft Lot
- West Facing Home
- Back Yard Fenced
- Block Wall Fence
Parking
- 3 Car Garage
Home Design
- Frame Construction
- Tile Roof
- Stucco
Interior Spaces
- 3,146 Sq Ft Home
- 2-Story Property
- Ceiling Fan
- 3 Fireplaces
- Gas Fireplace
- Blinds
- Tile Flooring
Kitchen
- Double Oven
- Built-In Gas Oven
- Gas Range
- Microwave
- Dishwasher
- Disposal
Bedrooms and Bathrooms
- 4 Bedrooms
- Fireplace in Bedroom
Laundry
- Laundry Room
- Laundry on main level
- Washer and Dryer
Pool
- Private Pool
- Spa
Schools
- Ober Elementary School
- Johnson Walter Middle School
- Bonanza High School
Utilities
- Central Heating and Cooling System
- Heating System Uses Gas
- Cable TV Available
Listing and Financial Details
- Security Deposit $4,350
- Property Available on 6/5/25
- Tenant pays for cable TV, electricity, gas, pool maintenance, sewer, trash collection, water
- 12 Month Lease Term
Community Details
Overview
- Property has a Home Owners Association
- Canyon Gate Association, Phone Number (702) 869-0937
- Foothills Cntry Club Subdivision
- The community has rules related to covenants, conditions, and restrictions
Amenities
- Clubhouse
Recreation
- Golf Course Community
- Tennis Courts
- Community Basketball Court
- Community Playground
- Community Pool
- Park
Pet Policy
- No Pets Allowed
Security
- Security Guard
- Gated Community
Map
Source: Las Vegas REALTORS®
MLS Number: 2690025
APN: 163-05-813-048
Disclaimer: Certain information contained herein is derived from information provided by parties other than Homes.com. All information provided is deemed reliable, but is not guaranteed to be accurate and should be independently verified.
![]() The data relating to real estate for sale on this web site comes in part from the INTERNET DATA EXCHANGE Program of the Greater Las Vegas Association of REALTORS® MLS. Real estate listings held by brokerage firms other than this site owner are marked with the IDX logo. Information is deemed reliable but not guaranteed. Copyright 2025 of the Greater Las Vegas Association of REALTORS® MLS. All rights reserved.
The data relating to real estate for sale on this web site comes in part from the INTERNET DATA EXCHANGE Program of the Greater Las Vegas Association of REALTORS® MLS. Real estate listings held by brokerage firms other than this site owner are marked with the IDX logo. Information is deemed reliable but not guaranteed. Copyright 2025 of the Greater Las Vegas Association of REALTORS® MLS. All rights reserved.
- 8761 Rainbow Ridge Dr
- 2200 Glenbrook Way
- 2204 Glenbrook Way
- 2209 Glenbrook Way
- 2213 Glenbrook Way
- 8848 Rainbow Ridge Dr
- 8617 Titleist Cir
- 8625 Scarsdale Dr
- 8925 Wild Creek Ct Unit 3305
- 1813 Skyline Dr
- 1905 Iron Ridge Dr
- 2708 Beaver Creek Ct Unit 202
- 2701 Beaver Creek Ct Unit 201
- 8721 Robinson Ridge Dr
- 8729 Pesaro Dr
- 2724 Otter Creek Ct Unit 101
- 2605 S Durango Dr Unit 202
- 2627 S Durango Dr Unit 202
- 2627 S Durango Dr Unit 201
- 2633 S Durango Dr Unit 202
- 2312 Glenbrook Way
- 8917 Canyon Springs Dr
- 8628 Scarsdale Dr
- 2700 Baycliff Ct Unit 201
- 2291 Autumn Fire Ct
- 2611 S Durango Dr Unit 201
- 8530 W Sahara Ave
- 2629 S Durango Dr Unit 202
- 2623 S Durango Dr Unit 102
- 9005 Opus Dr
- 8917 Antioch Way
- 2606 S Durango Dr Unit 245
- 2606 S Durango Dr Unit 221
- 8600 Starboard Dr
- 2304 Pacific Brook St
- 2200 S Fort Apache Rd Unit 2173
- 2200 S Fort Apache Rd Unit 1105
- 2200 S Fort Apache Rd Unit 2104
- 2200 S Fort Apache Rd Unit 1064
- 8455 W Sahara Ave Unit 146
