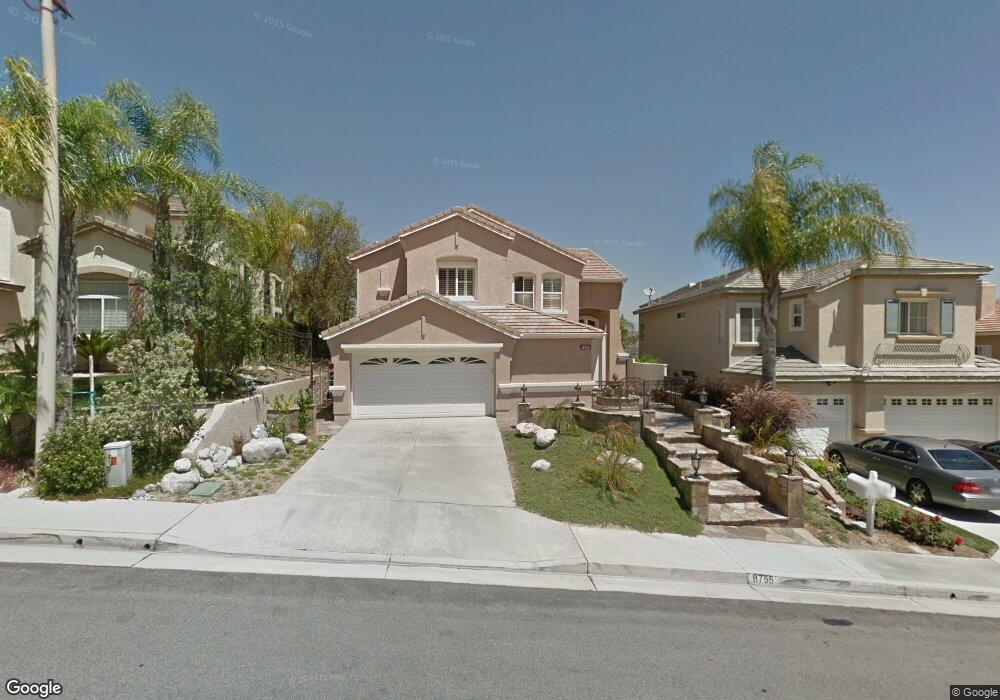
8755 E Banner Ridge Dr Anaheim, CA 92808
Anaheim Hills NeighborhoodEstimated Value: $1,439,000 - $1,702,000
4
Beds
4
Baths
2,564
Sq Ft
$604/Sq Ft
Est. Value
About This Home
This home is located at 8755 E Banner Ridge Dr, Anaheim, CA 92808 and is currently estimated at $1,547,515, approximately $603 per square foot. 8755 E Banner Ridge Dr is a home located in Orange County with nearby schools including Running Springs Elementary, Canyon High School, and El Rancho Charter.
Ownership History
Date
Name
Owned For
Owner Type
Purchase Details
Closed on
Sep 30, 2016
Sold by
Pirnia Hootan and Pirnia Soheila
Bought by
Pirnia Hootan and Pirnia Scheila
Current Estimated Value
Purchase Details
Closed on
Sep 23, 2009
Sold by
Lampkin Paul and Lampkin Denise
Bought by
Pirnia Hootan and Pirnia Soheila
Home Financials for this Owner
Home Financials are based on the most recent Mortgage that was taken out on this home.
Original Mortgage
$235,000
Outstanding Balance
$152,199
Interest Rate
5%
Mortgage Type
New Conventional
Estimated Equity
$1,395,316
Purchase Details
Closed on
Dec 5, 1997
Sold by
Shea Homes Ltd Partnership
Bought by
Lampkin Paul and Lampkin Denise
Home Financials for this Owner
Home Financials are based on the most recent Mortgage that was taken out on this home.
Original Mortgage
$255,300
Interest Rate
7.31%
Create a Home Valuation Report for This Property
The Home Valuation Report is an in-depth analysis detailing your home's value as well as a comparison with similar homes in the area
Home Values in the Area
Average Home Value in this Area
Purchase History
| Date | Buyer | Sale Price | Title Company |
|---|---|---|---|
| Pirnia Hootan | -- | None Available | |
| Pirnia Hootan | $685,000 | North American Title Company | |
| Lampkin Paul | $319,500 | First American Title Ins |
Source: Public Records
Mortgage History
| Date | Status | Borrower | Loan Amount |
|---|---|---|---|
| Open | Pirnia Hootan | $235,000 | |
| Previous Owner | Lampkin Paul | $255,300 |
Source: Public Records
Tax History Compared to Growth
Tax History
| Year | Tax Paid | Tax Assessment Tax Assessment Total Assessment is a certain percentage of the fair market value that is determined by local assessors to be the total taxable value of land and additions on the property. | Land | Improvement |
|---|---|---|---|---|
| 2025 | $9,482 | $884,209 | $476,112 | $408,097 |
| 2024 | $9,482 | $866,872 | $466,776 | $400,096 |
| 2023 | $9,273 | $849,875 | $457,624 | $392,251 |
| 2022 | $9,094 | $833,211 | $448,651 | $384,560 |
| 2021 | $8,837 | $816,874 | $439,854 | $377,020 |
| 2020 | $8,755 | $808,498 | $435,343 | $373,155 |
| 2019 | $8,642 | $792,646 | $426,807 | $365,839 |
| 2018 | $8,509 | $777,104 | $418,438 | $358,666 |
| 2017 | $8,151 | $761,867 | $410,233 | $351,634 |
| 2016 | $7,991 | $746,929 | $402,189 | $344,740 |
| 2015 | $7,828 | $735,710 | $396,148 | $339,562 |
| 2014 | $7,719 | $721,299 | $388,388 | $332,911 |
Source: Public Records
Map
Nearby Homes
- 839 S Yellowstone Way Unit 192
- 8472 E Tioga Way
- 8420 E Tioga Way Unit 185
- 885 S Country Glen Way
- 922 S Country Glen Way
- 8444 E Teton Ct Unit 269
- 8449 E Arrowhead Way
- 8596 E Canyon Vista Dr
- 1232 S Country Glen Way
- 1218 S Country Glen Way
- 1012 S Silver Star Way
- 859 S Parkglen Place
- 8227 E White Fir Ln
- 23482 Cambridge Rd Unit 294
- 927 S Lone Pine Ln
- 23502 Cambridge Rd Unit 306
- 23556 Cambridge Rd Unit 327
- 6205 Plymouth Ct Unit 113
- 381 S Lilac Ct
- 6040 Vermont Ct Unit 80
- 8751 E Banner Ridge Dr
- 8761 E Banner Ridge Dr
- 8745 E Banner Ridge Dr
- 8765 E Banner Ridge Dr
- 8760 E Garden View Dr
- 8754 E Garden View Dr
- 8770 E Garden View Dr
- 8741 E Banner Ridge Dr
- 8760 E Banner Ridge Dr
- 8771 E Banner Ridge Dr
- 8770 E Banner Ridge Dr
- 8754 E Banner Ridge Dr
- 8750 E Garden View Dr
- 8774 E Garden View Dr
- 8750 E Banner Ridge Dr
- 8774 E Banner Ridge Dr
- 8735 E Banner Ridge Dr
- 8744 E Garden View Dr
- 8780 E Garden View Dr
- 8775 E Banner Ridge Dr