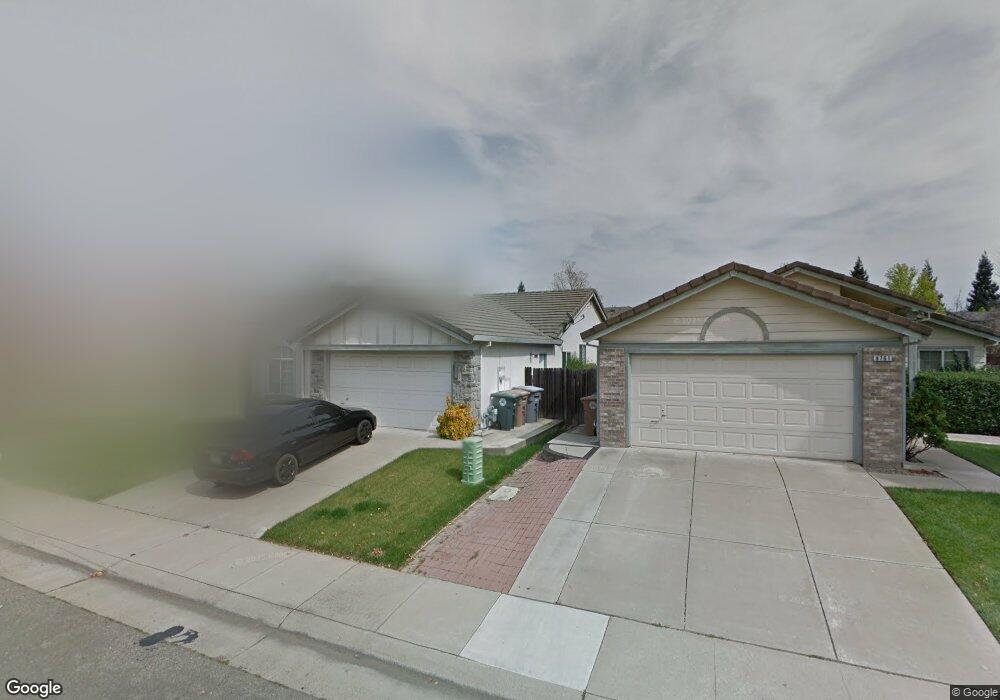
8757 Clay Glen Way Elk Grove, CA 95758
North West Elk Grove NeighborhoodEstimated Value: $171,000 - $494,000
3
Beds
2
Baths
1,133
Sq Ft
$349/Sq Ft
Est. Value
About This Home
This home is located at 8757 Clay Glen Way, Elk Grove, CA 95758 and is currently estimated at $395,603, approximately $349 per square foot. 8757 Clay Glen Way is a home located in Sacramento County with nearby schools including Marion Mix Elementary School, Harriet G. Eddy Middle School, and Laguna Creek High School.
Ownership History
Date
Name
Owned For
Owner Type
Purchase Details
Closed on
Apr 4, 2011
Sold by
Capitol City Homes Llc
Bought by
Chan Paul Y and Chan Sharon S
Current Estimated Value
Purchase Details
Closed on
Mar 25, 2011
Sold by
Pante Alberto and Pante Flordeliza
Bought by
Capitol City Homes Llc
Purchase Details
Closed on
Sep 26, 2005
Sold by
Pante Alberto and Pante Flordeliza
Bought by
Pante Alberto and Pante Flordeliza
Purchase Details
Closed on
Jul 16, 2001
Sold by
Goto Douglas
Bought by
Pante Alberto and Pante Flordeliza
Home Financials for this Owner
Home Financials are based on the most recent Mortgage that was taken out on this home.
Original Mortgage
$164,875
Interest Rate
7.21%
Mortgage Type
Stand Alone First
Create a Home Valuation Report for This Property
The Home Valuation Report is an in-depth analysis detailing your home's value as well as a comparison with similar homes in the area
Home Values in the Area
Average Home Value in this Area
Purchase History
| Date | Buyer | Sale Price | Title Company |
|---|---|---|---|
| Chan Paul Y | $114,000 | Old Republic Title Company | |
| Capitol City Homes Llc | $114,000 | None Available | |
| Pante Alberto | -- | -- | |
| Pante Alberto | $165,000 | Stewart Title |
Source: Public Records
Mortgage History
| Date | Status | Borrower | Loan Amount |
|---|---|---|---|
| Previous Owner | Pante Alberto | $164,875 |
Source: Public Records
Tax History Compared to Growth
Tax History
| Year | Tax Paid | Tax Assessment Tax Assessment Total Assessment is a certain percentage of the fair market value that is determined by local assessors to be the total taxable value of land and additions on the property. | Land | Improvement |
|---|---|---|---|---|
| 2025 | $2,282 | $171,660 | $43,550 | $128,110 |
| 2024 | $2,282 | $168,296 | $42,697 | $125,599 |
| 2023 | $2,217 | $164,997 | $41,860 | $123,137 |
| 2022 | $2,182 | $161,763 | $41,040 | $120,723 |
| 2021 | $2,130 | $158,592 | $40,236 | $118,356 |
| 2020 | $2,098 | $156,967 | $39,824 | $117,143 |
| 2019 | $2,058 | $153,891 | $39,044 | $114,847 |
| 2018 | $2,005 | $150,875 | $38,279 | $112,596 |
| 2017 | $1,965 | $147,918 | $37,529 | $110,389 |
| 2016 | $1,885 | $145,019 | $36,794 | $108,225 |
| 2015 | $1,848 | $142,842 | $36,242 | $106,600 |
| 2014 | $1,827 | $140,045 | $35,533 | $104,512 |
Source: Public Records
Map
Nearby Homes
- 5310 Privet Ln
- 8741 Noble Fir Ln
- 4910 Harrow Dr
- 6024 Deepdale Way
- 0 Elliott Ranch Rd Unit 225131105
- 6009 Greybridge Ct
- 8959 Boreal Way
- 1312 Winterhart St
- 5013 Efthemia Way
- 6131 Jacinto Ave
- 8944 Warmsprings St
- 5208 Misty Meadow Way
- 5161 Saint Edwards Way
- Residence 2125 Plan at Tegan Estates
- Residence 1845 Plan at Tegan Estates
- Residence 1960 Plan at Tegan Estates
- Residence 1850 Plan at Tegan Estates
- 8451 Montpelier Way
- 8647 Starburst Way
- 9105 Turnbull Ct
- 8761 Clay Glen Way
- 8753 Clay Glen Way
- 8749 Clay Glen Way
- 8765 Clay Glen Way
- 5229 Moon Run Way
- 5311 Privet Ln
- 8769 Clay Glen Way
- 5244 Stoney Creek Way
- 5225 Moon Run Way
- 5313 Privet Ln
- 8766 Clay Glen Way
- 5324 Rose Bay Ln
- 8741 Clay Glen Way
- 8775 Clay Glen Way
- 5240 Stoney Creek Way
- 5221 Moon Run Way
- 5326 Rose Bay Ln
- 8770 Clay Glen Way
- 8737 Clay Glen Way
- 8781 Clay Glen Way