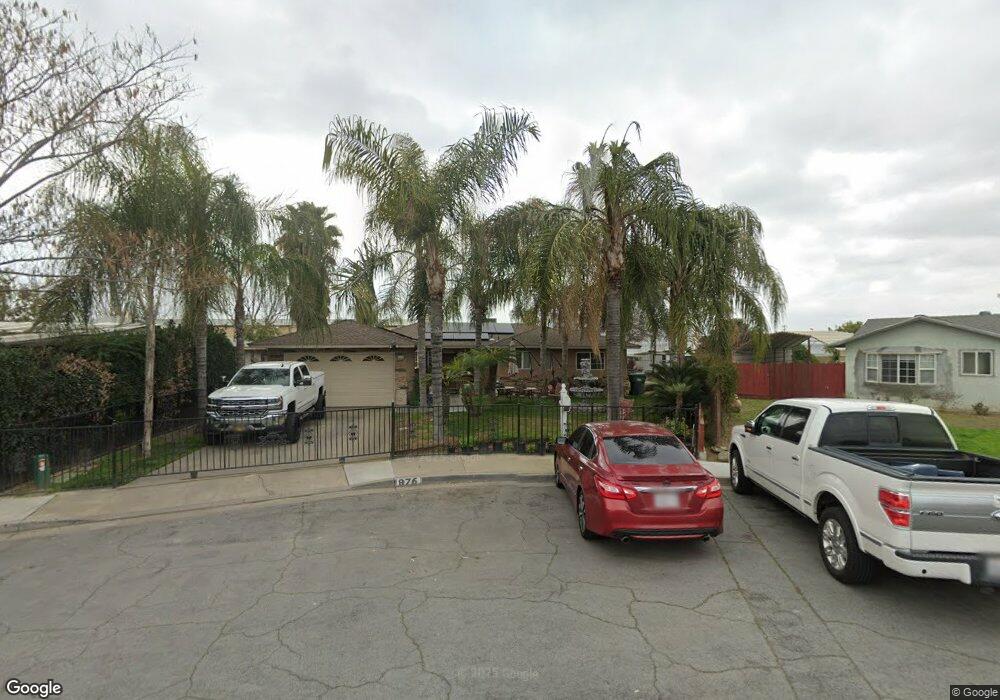
876 12th St Sanger, CA 93657
Estimated Value: $306,000 - $328,942
4
Beds
2
Baths
1,303
Sq Ft
$243/Sq Ft
Est. Value
About This Home
This home is located at 876 12th St, Sanger, CA 93657 and is currently estimated at $315,981, approximately $242 per square foot. 876 12th St is a home located in Fresno County with nearby schools including Jefferson Elementary School, Washington Academic Middle School, and Sanger High School.
Ownership History
Date
Name
Owned For
Owner Type
Purchase Details
Closed on
Mar 7, 2006
Sold by
Duran Bulmaro
Bought by
Duran Agustina
Current Estimated Value
Home Financials for this Owner
Home Financials are based on the most recent Mortgage that was taken out on this home.
Original Mortgage
$51,800
Outstanding Balance
$18,966
Interest Rate
6.19%
Mortgage Type
Credit Line Revolving
Estimated Equity
$297,015
Purchase Details
Closed on
Feb 6, 2006
Sold by
Segura Jose Alonzo and Segura Eugenia Morado
Bought by
Duran Agustina
Home Financials for this Owner
Home Financials are based on the most recent Mortgage that was taken out on this home.
Original Mortgage
$51,800
Outstanding Balance
$18,966
Interest Rate
6.19%
Mortgage Type
Credit Line Revolving
Estimated Equity
$297,015
Create a Home Valuation Report for This Property
The Home Valuation Report is an in-depth analysis detailing your home's value as well as a comparison with similar homes in the area
Home Values in the Area
Average Home Value in this Area
Purchase History
| Date | Buyer | Sale Price | Title Company |
|---|---|---|---|
| Duran Agustina | -- | North American Title Company | |
| Duran Agustina | $259,000 | North American Title Company |
Source: Public Records
Mortgage History
| Date | Status | Borrower | Loan Amount |
|---|---|---|---|
| Open | Duran Agustina | $51,800 | |
| Open | Duran Agustina | $207,200 |
Source: Public Records
Tax History
| Year | Tax Paid | Tax Assessment Tax Assessment Total Assessment is a certain percentage of the fair market value that is determined by local assessors to be the total taxable value of land and additions on the property. | Land | Improvement |
|---|---|---|---|---|
| 2025 | $3,929 | $310,000 | $50,000 | $260,000 |
| 2023 | $2,767 | $223,600 | $46,800 | $176,800 |
| 2022 | $2,674 | $215,000 | $45,000 | $170,000 |
| 2021 | $2,094 | $165,900 | $37,400 | $128,500 |
| 2020 | $2,034 | $164,300 | $37,100 | $127,200 |
| 2019 | $1,995 | $161,200 | $36,400 | $124,800 |
| 2018 | $1,913 | $158,100 | $35,700 | $122,400 |
| 2017 | $1,880 | $155,000 | $35,000 | $120,000 |
| 2016 | $1,745 | $150,000 | $30,000 | $120,000 |
| 2015 | $1,957 | $164,600 | $38,100 | $126,500 |
| 2014 | $1,846 | $154,200 | $35,700 | $118,500 |
Source: Public Records
Map
Nearby Homes
Your Personal Tour Guide
Ask me questions while you tour the home.